Figure 8.

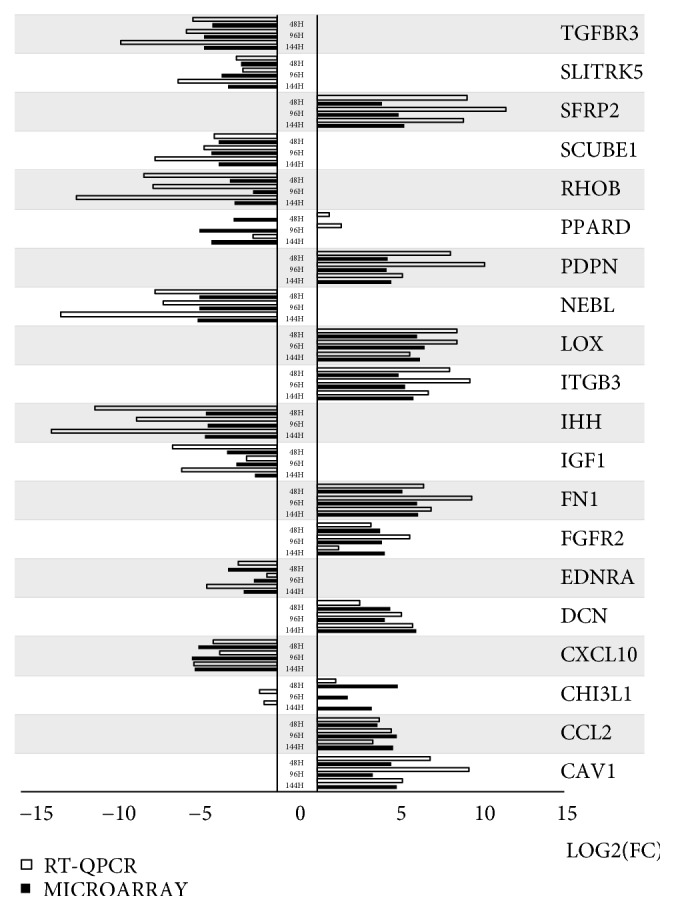
Fold changes of gene expression obtained through RT-qPCR analysis compared to the output of expression microarrays, presented as a bar graph.

Fold changes of gene expression obtained through RT-qPCR analysis compared to the output of expression microarrays, presented as a bar graph.