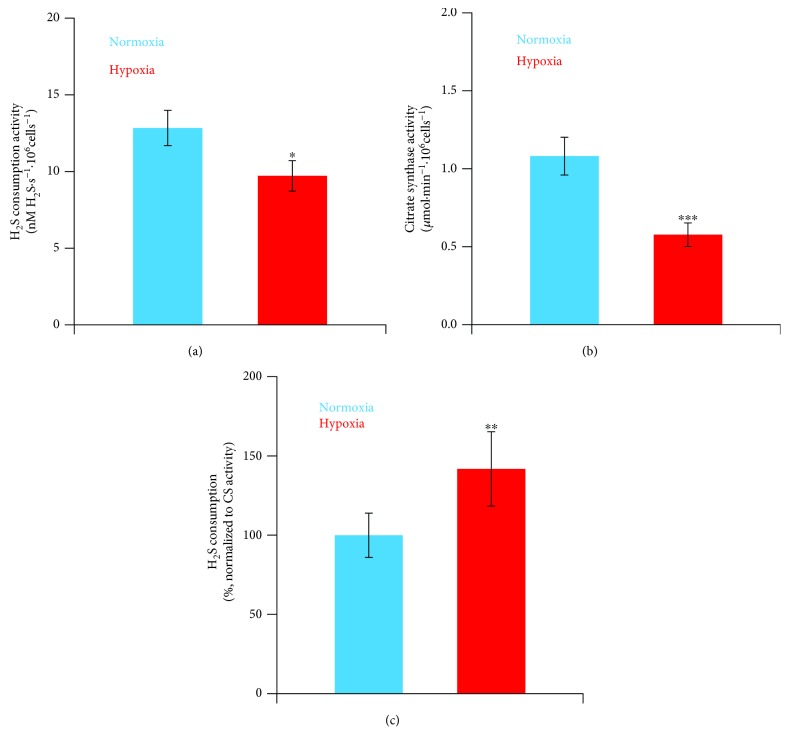
Figure 2.
Effect of hypoxia on mitochondrial sulfide consumption. (a) Mean values of maximal estimated sulfide consumption activity (calculated as described in the legend of Figure 1(c)), measured in normoxic (n = 9, blue bar) and hypoxia-treated (n = 8, red bar) cells. (b) Citrate synthase activity in normoxic (n = 13, blue bar) and hypoxia-treated (n = 10, red bar) cell lysates. (c) Maximal sulfide consumption activity normalized to the citrate synthase activity, as measured in normoxic (blue bar) and hypoxia-treated (red bar) cells. ∗P ≤ 0.05; ∗∗P ≤ 0.01; ∗∗∗P ≤ 0.001.

