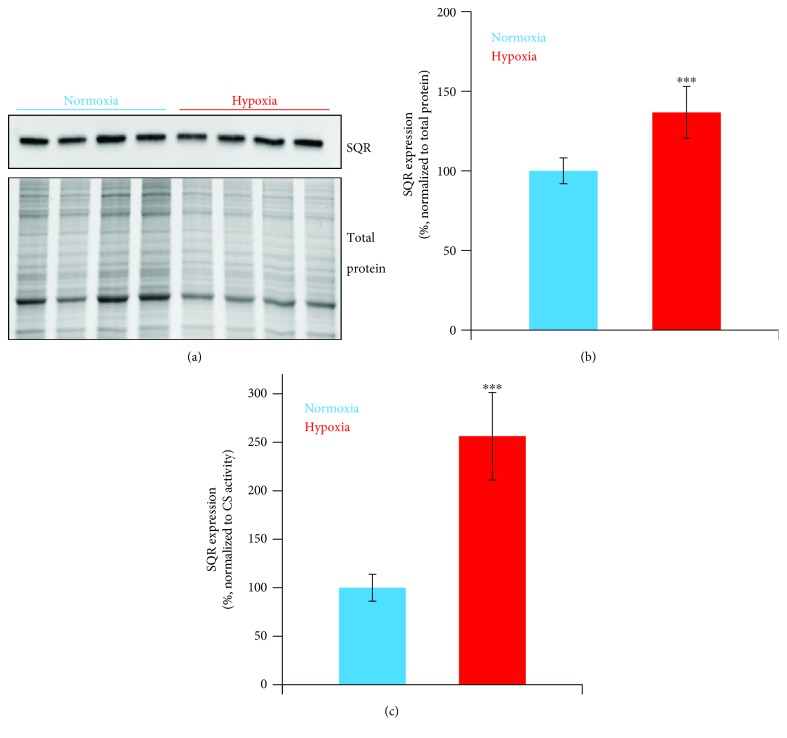
Figure 3.
Effect of hypoxia on SQR expression. Representative Western blot analyzing SQR expression in normoxic and hypoxia-exposed SW480 cells (a), with the corresponding total protein load quantitation by stain-free imaging technology (see Materials and Methods). SQR levels in normoxic (n = 4 in triplicate, blue bars) and hypoxia-treated cells (n = 4 in triplicate, red bars), as normalized to total protein (b) or citrate synthase activity (c). ∗∗∗P ≤ 0.001.

