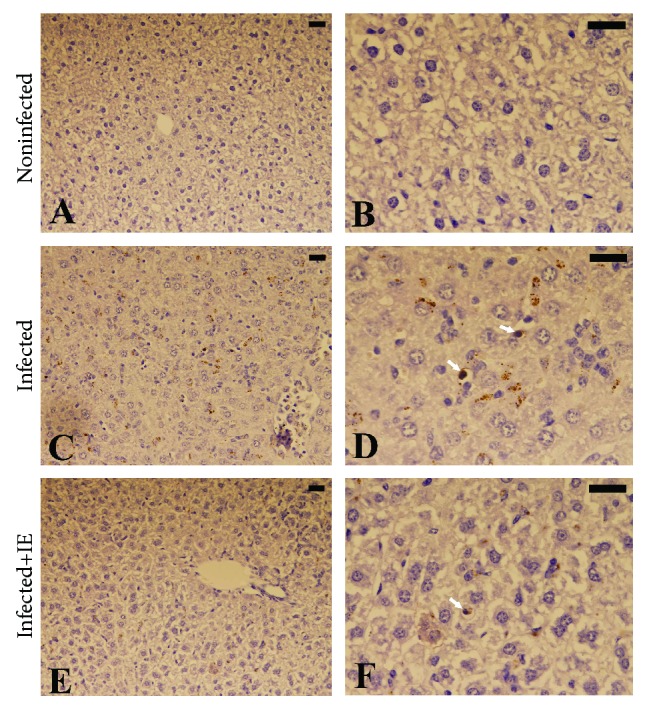
Figure 2.

Apoptotic changes in mouse livers infected with P. chabaudi and treated with IE. (a, b) Control liver. (c, d) Infected liver with TUNEL apoptotic cells (white arrow) and hemozoin. (e, f) Liver from the treatment group with a few TUNEL-positive apoptotic cells. Scale bar = 25 μm.
