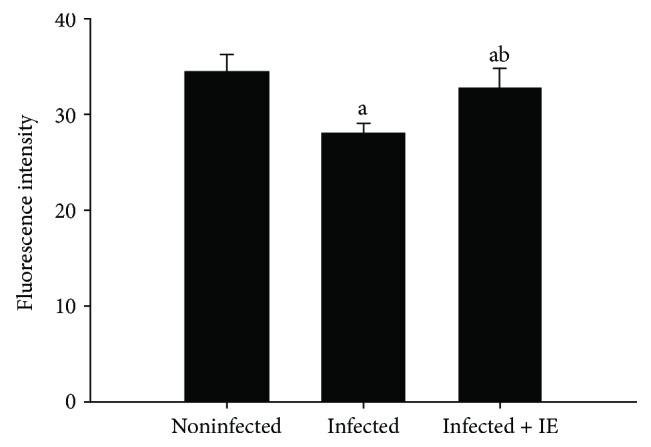
Figure 6.

Semiquantitative evaluation of the fluorescence intensity of five cryosections per mouse. Data are expressed as means ± SD; a: significant change at p ≤ 0.05 with respect to the control group; b: significant change at p ≤ 0.05 with respect to the infected (−IE) group.
