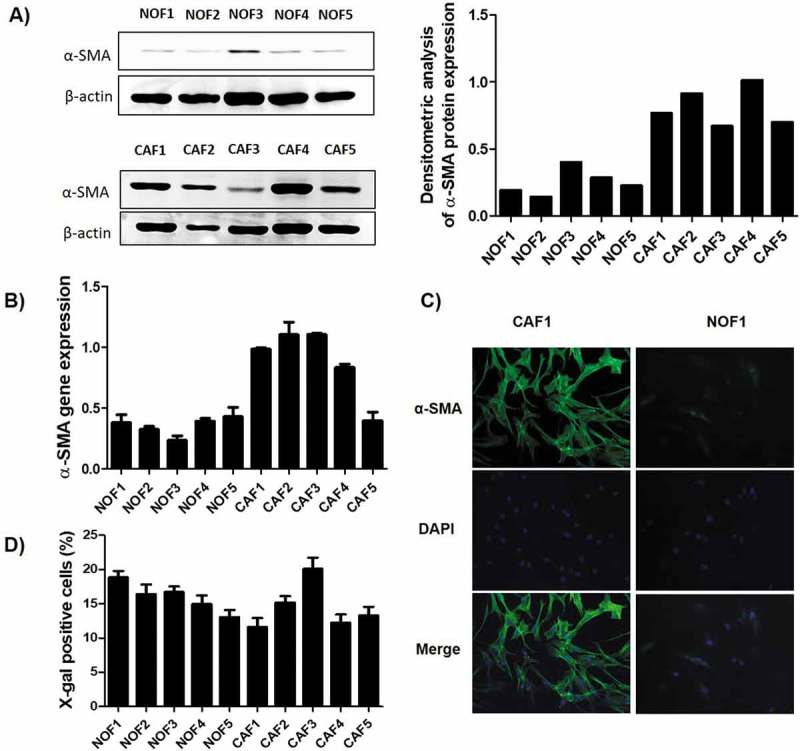
Figure 1.

Characterization of the primary NOF and CAF cell cultures. The relative expression of α-SMA was higher in CAF when compared to NOF cells, as revealed by both western blot (a), which can be graphically visualized by the densitometry analysis relative to β-actin expression, and by qRT-PCR (b). (c) Representative images of CAF and NOF immunofluorescence assay revealed the stressed actin fibres typical of CAF. (d) The senescence of these cells was accessed by the expression of β-galactosidase activity, and the bars represent the percentage of positive cells. The senescence rate was of approximately 20% maximum for all cell cultures.
