Figure 5.

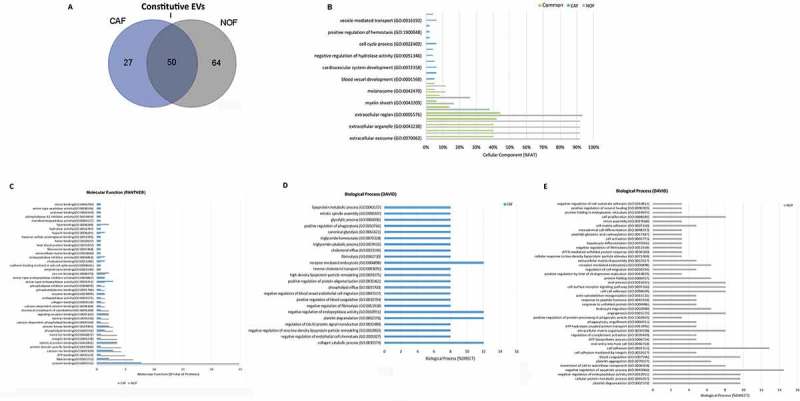
Proteome of constitutive EV released from Fibroblasts. (a) Venn diagram of the numerical values for common and unique proteins present in CAF (violet) and NOF (grey). (b) Analysis of cellular component GO terms. The proteins detected in both CAF and NOF fractions (total 50 constitutive EV proteins) were grouped using GO terms related to cellular component analysis process using DAVID [56]. (c) Analysis of molecular function GO terms of total EV proteins of both groups. (d, e) EV proteins were grouped in CAF (D) or NOF (E) using (GO) terms related to biological process analysis using DAVID (p < 0.05) and shown in Supplementary Table 7. The graph shows the percentage of proteins identified by mass spectrometry that fall into designated GO category relative to the total number of proteins in the category. GO FAT was used to minimize the redundancy of general GO terms in the analysis. Categories with enrichment greater than 6% are shown.
