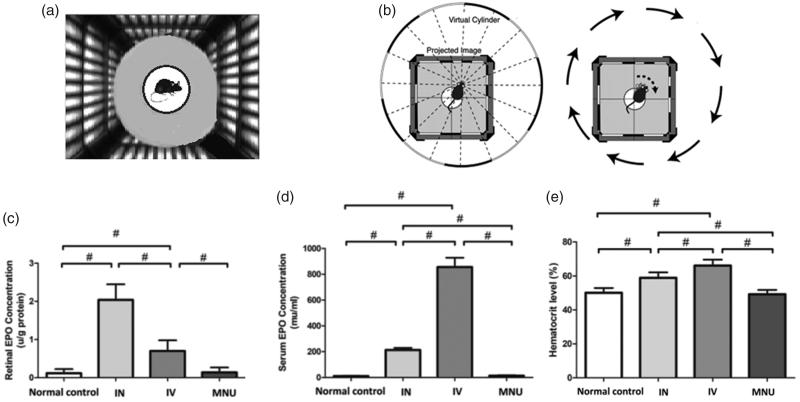
Figure 1.
(A) During the optokinetic behavioral test, the mouse was placed on a platform of the text box. Virtual cylinders were projected on the wall of the box and they turned either in clockwise or counter-clockwise direction for the mouse to track. (B) The optokinetic behavioral test was performed using a two-alternative forced choice paradigm. The right picture shows an example of track response when the virtual cylinders are turning in clockwise direction. (C) The EPO expression levels in the retinas of different animal groups. (D) The EPO expression levels in the serum of different animal groups. (ANOVA analysis followed by Bonferroni's post-hoc analysis was performed, #p < .01, for differences between groups; n = 10).

