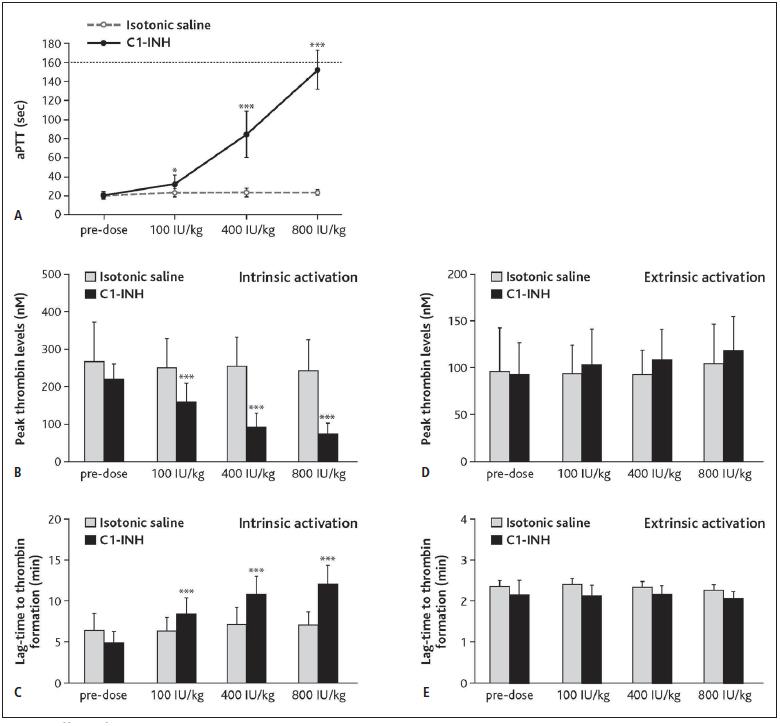
Figure 4: Effects of C1-esterase inhibitor (C1–INH) on activated partial thromboplastin time (aPTT) and thrombin generation in rabbits.

. Rabbits were injected with cumulative doses of C1–INH or equal volumes of isotonic saline and blood samples were drawn. A) APTT was measured following intrinsic activation (cut-off at 160 sec). Dots show means ± SD. B-C) Peak thrombin levels (B) and lag-time to thrombin formation (C) were measured by calibrated thrombography upon intrinsic activation. For A-C: *P=0.035, ***P< 0.001. Peak thrombin levels (D) and lag-time to thrombin formation (E) were measured by calibrated thrombography upon extrinsic activation. All data are statistically not significant with P≥ 0.05. For B-D: Bars show means ± SD.
