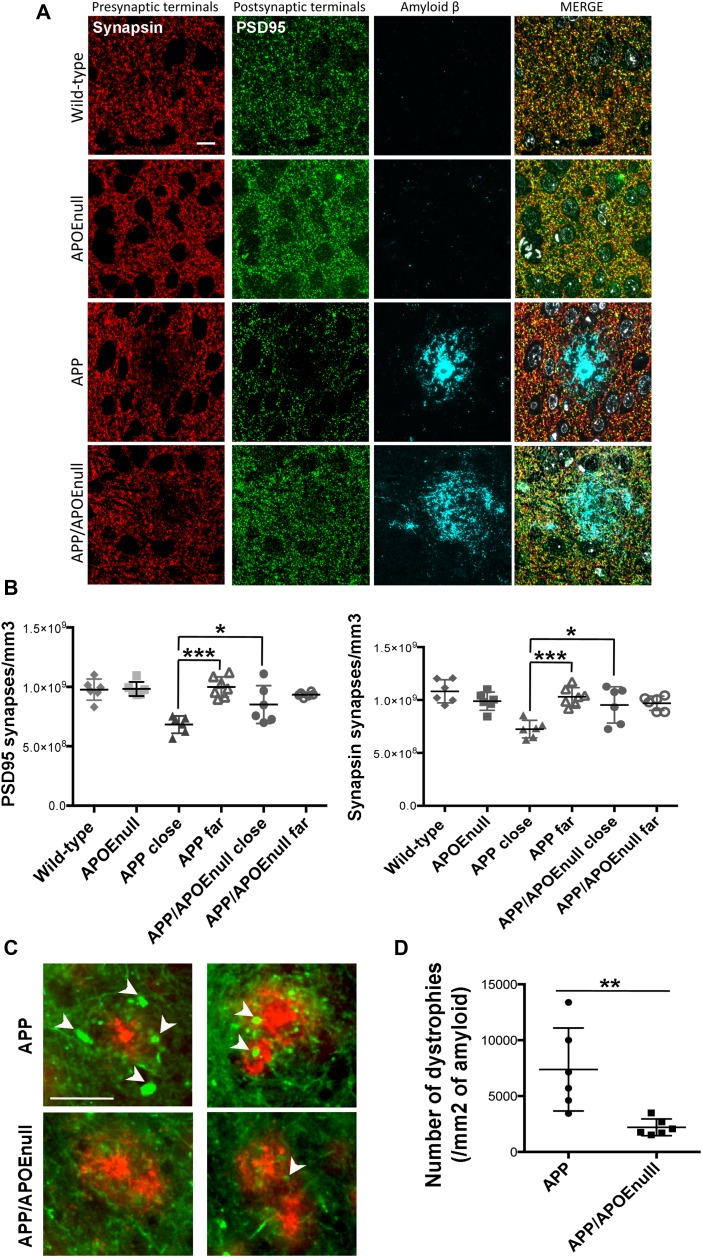
Figure 5. Ab-dependent synaptic loss and neuritic dystrophies in adult APP/PSEN1 and APP/PSEN1/APOEnull mice.
(A) Representative images of array tomography ribbons after immunostaining for Ab (1C22), presynaptic terminals (antisynapsin I, red), postsynaptic densities (anti-PS95, green), and nuclei (DAPI, blue). It is possible to appreciate how diffuse is the amyloid in the brain of APP/APOEnull mouse as compared with the compact staining observed in the APP mouse. Scale bar = 10 μm. (B) Scatter dot plots summarizing the density of PSD95 (left panel) and synapsin (right panel)-positive puncta in the cortex of wild-type, APOEnull, APP/PSEN1, and APP/PSEN1/APOEnull mice. A significant decrease in synaptic density was only observed in the close vicinity of amyloid plaques in AD transgenic mice. n = 6 mice/group (10–12 mo “adult” cohort); Two-way ANOVA and Tukey’s post hoc test. *P < 0.05 and ***P < 0.0001. (C) Representative images of neuritic dystrophies (arrows) around amyloid plaques observed in APP/PSEN1 and APP/PSEN1/APOEnull mice, showing that most sprouting axons are found in mice expressing endogenous murine apoE. Scale bar = 50 μm. (D) Scatter dot plot summarizing the stereological quantification of the number of dystrophies observed per area of amyloid (evaluated by immunohistological staining). n = 6 mice per group (10–12 mo “adult” cohort); Mann–Whitney test. *P < 0.005.

