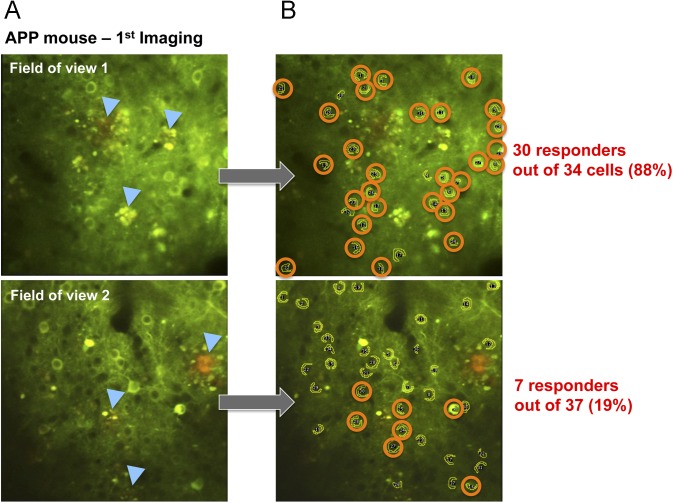
Figure S2. Variation of the proportions of responding neurons between fields of view during imaging.
(A) Representative two-photon images of AAV-CBA-YC3.6 neurons in two different fields of view recorded the same day in the same animal (APP/PSEN1 mouse, with amyloid deposits indicated by blue arrows). (B) All the cells that were identified as responsive to the visual stimuli were circled, showing that the local proportion of responsive neurons can greatly vary (from 88 to 19%) accordingly to each field of view imaged.

