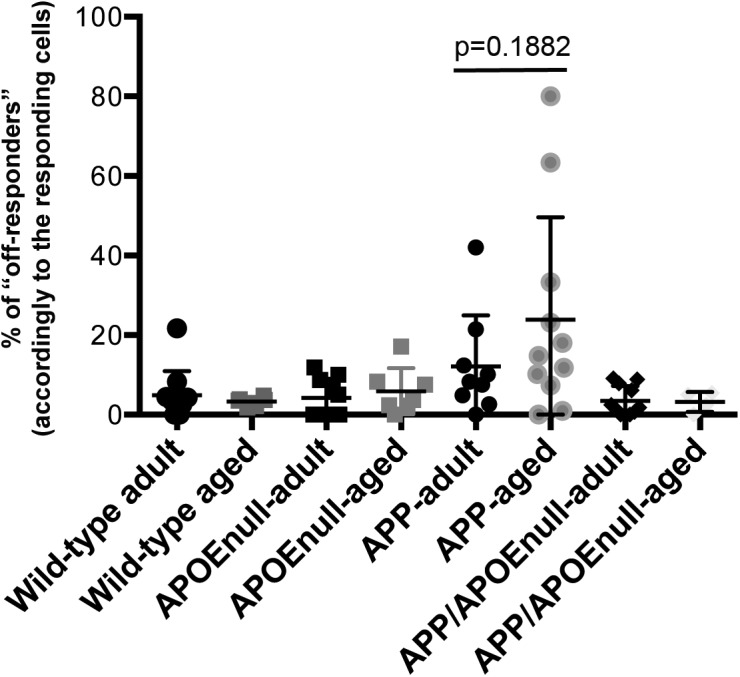
Figure S3. Percentage of “off-responding” neurons accordingly to the genotype and age.

Scatter dot plot representing the percentage of “off-responding” cells across genotypes and age groups. Although the average calculated for the APP/PSEN1 “aged” group (23.91 ± 15.72) was increased as compared with adult APP/PSEN1 mice (12.14 ± 11.8), the difference did not reach significance (P = 0.1882).
