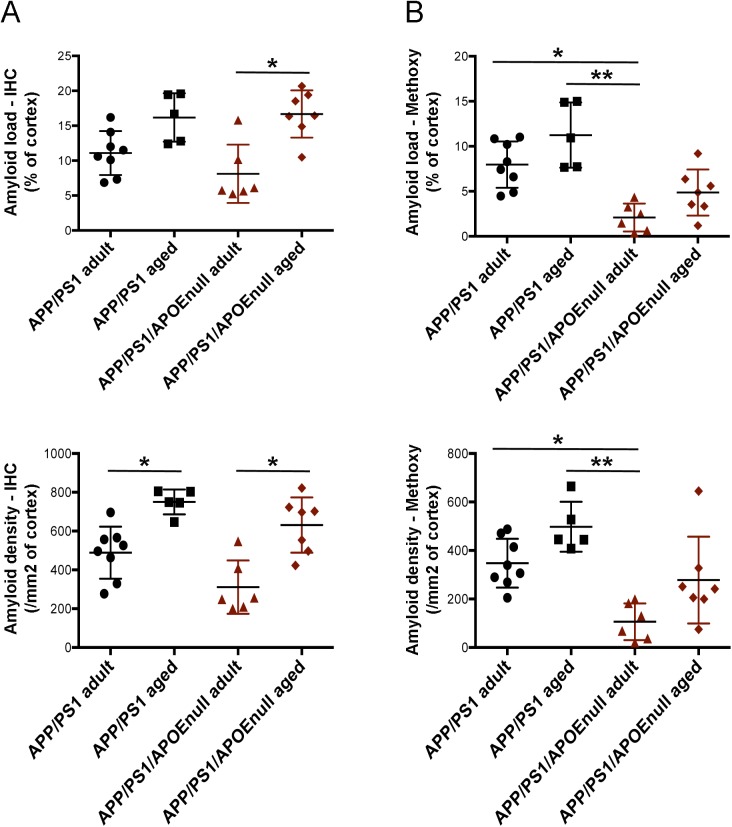
Figure S5. Comparison of amyloid pathology in adult and aged APP/PSEN1 and APP/PSEN1/APOEnull mice.
(A) Scatter dot plot representing the stereological quantification of amyloid load (A) in APP/PSEN1 and APP/PSEN1/APOEnull animals after anti-Aβ immunostaining (left panels) or Methoxy-XO4 labeling (right panels). (B) Scatter dot plot representing the stereological quantification of plaque density in the same animals. n = 8 adult and n = 5 aged APP/PSEN1 mice; n = 6 adult and n = 7 aged APP/PSEN1 mice; one-way ANOVA and post hoc Dunn’s multiple comparison test; *P < 0.05, **P < 0.005.

