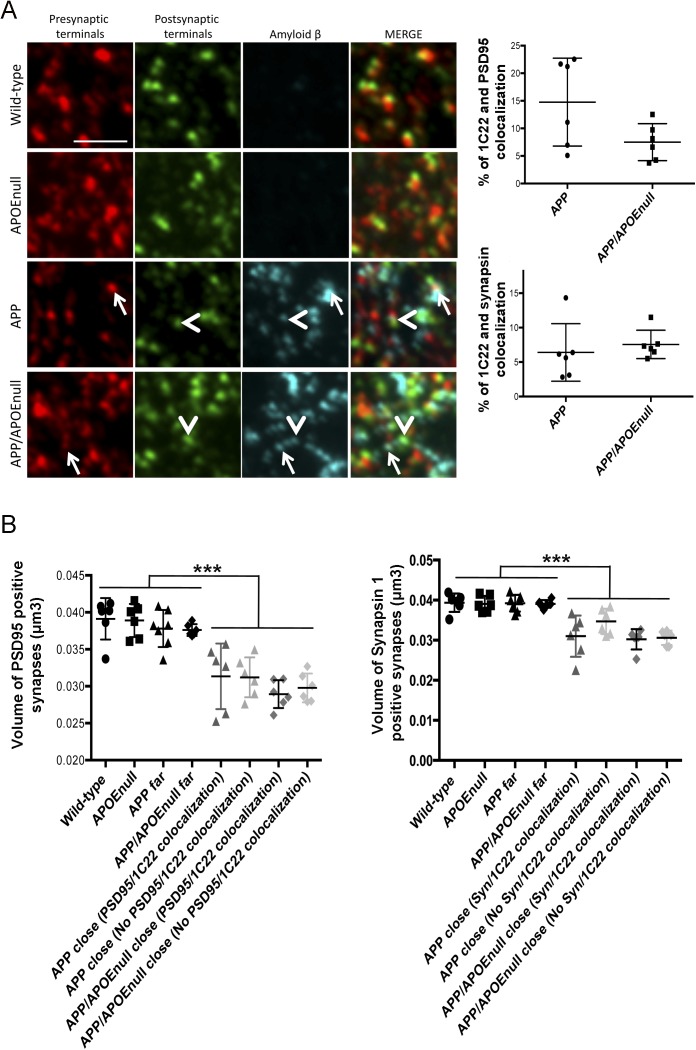
Figure S9. Co-localization between Aβ and synaptic terminals and evaluation of the synapse volume by array tomography.
(A) Array tomography images after staining for Aβ (1C22), pre- (synapsin), and post- (PSD95) synaptic terminals in cortical tissue of wild-type, APOEnull, APP/PSEN1, and APP/PSEN1/APOEnull mice. The white arrows (pre-synaptic) or arrowheads (post-synaptic) indicate the co-localization between Aβ and synaptic terminals. (B) Comparison of the percentage of co-localization between 1C22/PSD95 and 1C22/synapsin in APP and APP/APOEnull mice failed to show any significant difference between those groups (areas close to plaques were considered as those show significant staining with the anti-amyloid antibody 1C22). (C) Scatter dot plots representing the synaptic volume calculated from PSD95 (left panel) or Synapsin 1 (right panel) puncta between all the experimental groups. Although the synapses were significantly smaller around amyloid deposits, no difference was detected between APP/PSEN1 and APP/PSEN1/APOEnull mice. In addition, synapse shrinkage was observed whether or not Aβ co-localizes with each synaptic markers. n = 6 mice/group (10–12 mo “adult” cohort); one-way ANOVA; ***P < 0.0001.

