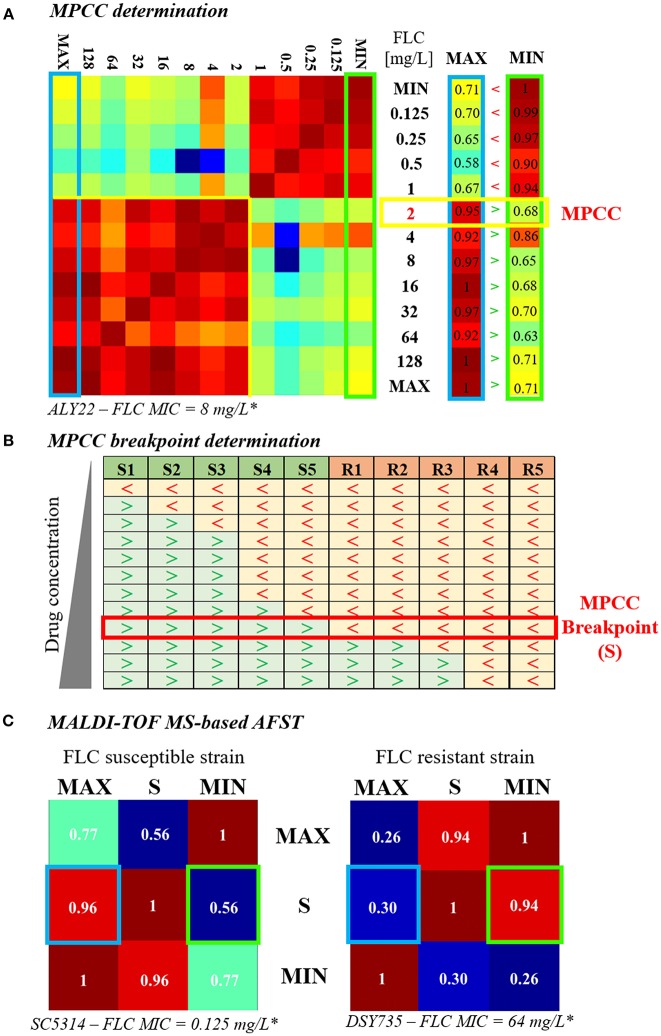
Figure 1.
Evolution of the MALDI-TOF MS-based AFST assay. (A) MPCC determination. A 13 × 13 CCI matrix (personal data) is generated by comparing the spectra obtained after exposure to increasing concentrations of fluconazole (0 = MIN to 256 μg/mL = MAX), as explained in De Carolis et al. (2012). Red gradient corresponds to strong correlations and blue gradient corresponds to weak ones. The first and the last column of the CCI matrix, namely the comparison of the spectra at all concentrations with the spectra at MAX (blue box) and at MIN (green box), respectively, are isolated. The MPCC (yellow box) corresponds to the fluconazole concentration at which the value of the MAX column is higher (>) than the value of the MIN column, at the same concentration. (B) MPCC breakpoint determination. MPCC values of several susceptible (S1 to S5) and resistant (R1 to R5) strains from the same Candida spp. are compared. “>” indicates that the spectra at the given concentration is more similar to the spectra at MAX, whereas “ < ” indicates that the spectra at the given concentration is more similar to the spectra at MIN. The MPCC breakpoint concentration (S) correspond to the fluconazole concentration which allow the best discrimination between the resistant and the susceptible strains (red box), as explained in De Carolis et al. (2012). (C) MALDI-TOF MS-based assay. A 3 × 3 CCI matrix is generated by comparing the spectra at MAX, S, and MIN, as presented in Vella et al. (2013). The results of the correlation between S and MAX (blue box) and S and MIN (green box) are compared. The strain is assessed as susceptible if the result of the correlation between S an MAX is higher than the result of the correlation between S and MIN (left matrix, personal data), whereas the strain is assessed as resistant if the result of the correlation between S an MAX is lower than the result of the correlation between S and MIN (right matrix, personal data).*Lohberger et al. (2014), FLC = fluconazole.

