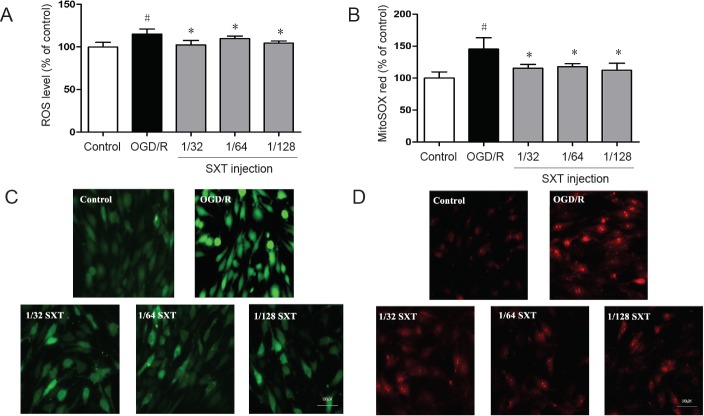
Figure 3.
Effect of SXT on ROS and mitochondrial peroxide production in bEnd.3 cells subjected to OGD/R.
(A, B) Intracellular ROS levels (A) and mitochondrial superoxide levels (B) detected by fluorescence analysis. Intracellular ROS levels or mitochondrial superoxide levels were expressed as fluorescence intensity percentage of control group. Data are expressed as the mean ± SD (mean from three independent experiments; one-way analysis of variance followed by the least significant difference test). #P < 0.05, vs. control group; *P < 0.05 vs. OGD/R group (n = 6). (C, D) Representative images of ROS (green) (C) and MitoSOX™ Red (red) (D). Scale bars: 100 μm. SXT: Shuxuetong injection; OGD/R: oxygen-glucose deprivation/reperfusion; ROS: reactive oxygen species.

