Figure 5.
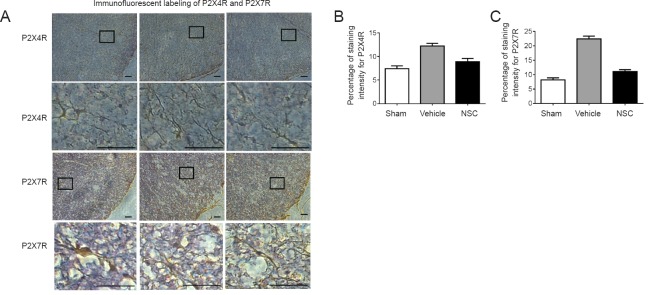
Immunofluorescent labeling of P2X4R and P2X7R.
(A) P2XR was mainly distributed in activated microglial cells. Expression of P2X4R and P2X7R in spinal cord sections was analyzed under a light microscope. Contents of the pane were enlarged to observe morphological changes. In the sham group, spinal cord tissue was normal, and microglia were stained brown-yellow, with prominent cell bodies and spider-like shapes. The vehicle group had small glial cells with narrow cell bodies, and slender synapses. The morphology of astrocytes in the NSC group was almost identical to the sham group. Scale bars: 200 µm. (B, C) Three random fields of view from each section. Data are expressed as the mean ± SEM (one-way analysis of variance followed by Tukey’s post hoc test). Experiments were performed in triplicate. NSC: Neural stem cells.

