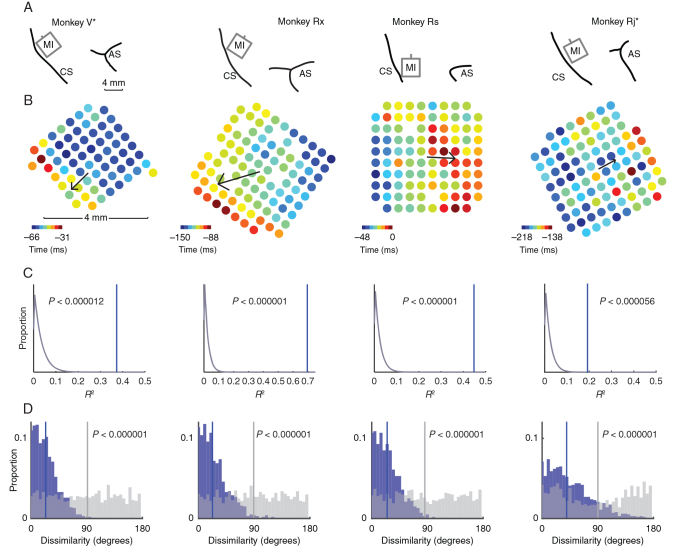
Figure 2.
Array placement and beta attenuation maps. ( A ). Line drawings depicting placement of the multielectrode arrays in the upper limb area of MI in 4 monkeys. The central and arcuate sulci are indicated (CS and AS, respectively). Data from monkeys V and Rj have been flipped vertically to normalize the location of the CS and AS across animals. ( B ). Heat maps depicting the timings of attenuation in beta amplitude across all electrodes on each array relative to movement onset (time = 0). We fit a linear model to describe the spatial progression of BATs from earlier to later. This BAO is indicated by a black arrow whose magnitude is proportional to the model's goodness of fit. ( C ). We performed a spatial shuffle analysis to test for the significance of the BAO. The spatial location of BATs was shuffled one million times. For each shuffle, we computed the BAO of the shuffled data and its goodness of fit, R 2 . The distribution of R 2 values for each monkey from shuffled data (gray curve) is shown, as well as the R 2 statistic observed in actual data (blue vertical line). The BAO was highly significant in all animals. ( D ). The consistency of the BAO was assessed with a bootstrap analysis. For each iteration of the bootstrap (1000 total), we randomly partitioned each dataset into halves. A BAO was estimated from the data in each half, and the angle between them was measured. The distribution of angular differences (blue bars) was compared with a null distribution of angular differences estimated from spatially shuffled data (gray bars) using the same shuffling procedure as ( C ). We found strong evidence that the angular differences we observed between BAOs estimated on subsets of trials were significantly less than what would be expected under chance (Kolmogorov–Smirnov test, P indicated on figure).

