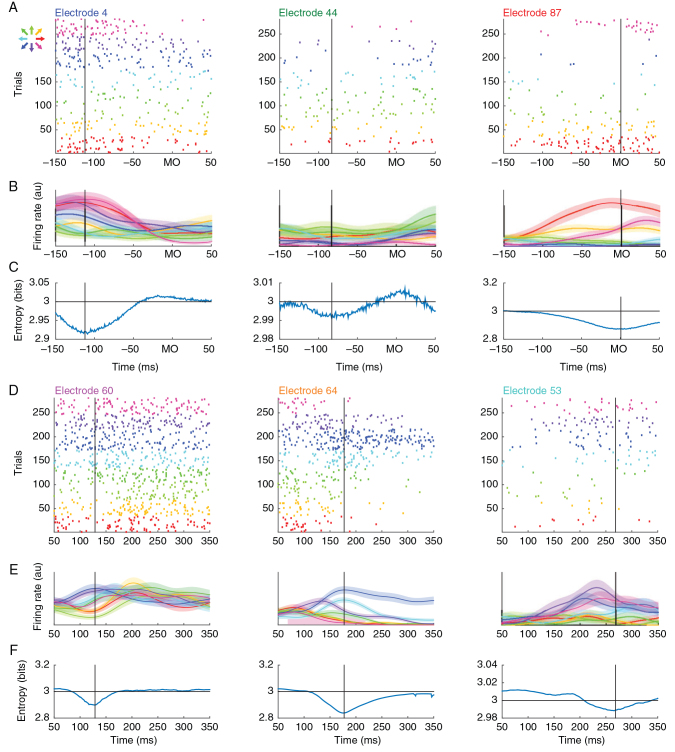
Figure 3.
Unit spiking analysis. ( A ). Raster plot of unit spiking activity on 3 electrodes corresponding to those in Figure 1 D. Each row in the raster indicates spiking activity on one trial aligned to movement onset. Color indicates the direction of movement. ( B ). Unit spiking activity was convolved with a Gaussian kernel and averaged across trials. Trial-averaged firing rates ± 1 SEM are shown for each movement direction. ( C ). Time-resolved entropy of the target direction probability distribution conditioned on the firing rates in ( B ). The dip in entropy reflects the directionally selective modulation of the neuron and is used to estimate its modulation time (vertical black line). Note that UMT follows the same pattern as BATs in Figure 1 E. ( D–F ). Three additional units that show significant modulation during movement preparation following the same conventions as ( A–C ) except data are aligned to the instruction cue. In both epochs, we have attempted to show units that are modulated early (left column), intermediately (center), or late (right) in their respective task epochs. During execution, the spatio-temporal sequence of unit modulation is consistent with the spatio-temporal sequence of beta attenuation; however, this consistency is absent during motor preparation.

