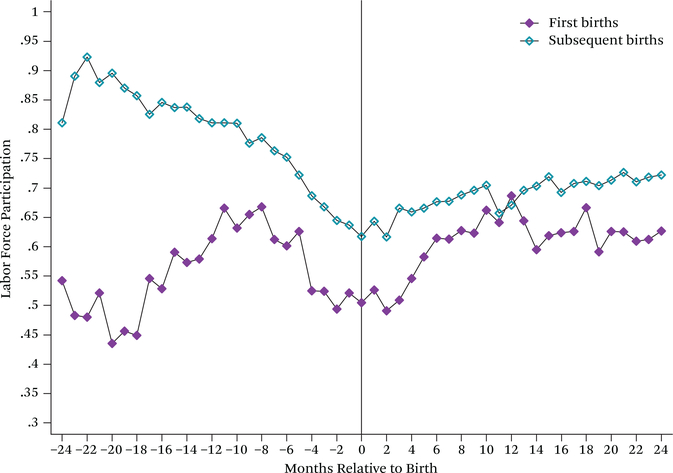
Figure 23. Opting Out in the 2000s, Blacks, Less than Bachelor’s.
Source: Author’s calculations based on the 2004 and 2008 Survey of Income and Program Participation panels.
Notes: Women age eighteen to forty-five who give birth during the panels. Plots show labor-force participation from twenty-four months before to twenty-four months after birth (plotting the coefficients from equation (1) added to the constant with dependent variable an indicator for being in the labor force estimated separately by race, education, and parity).

