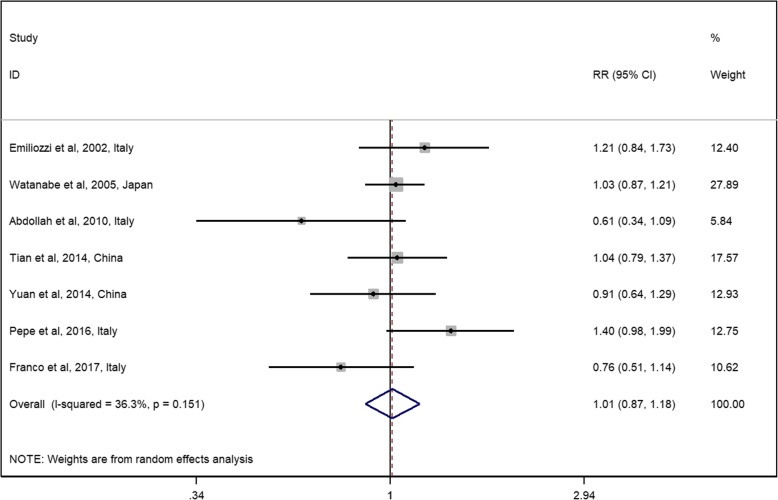
Fig. 3.
Relative risks for observational studies assessing the diagnosis rate of the TP approach vs the TR approach. Notes: diamonds represent study-specific relative risks (RRs) or summary relative risks with 95% confidence intervals (CIs). Horizontal lines represent 95% CIs. Test for heterogeneity among studies: P = 0.151, I2 = 36.3%

