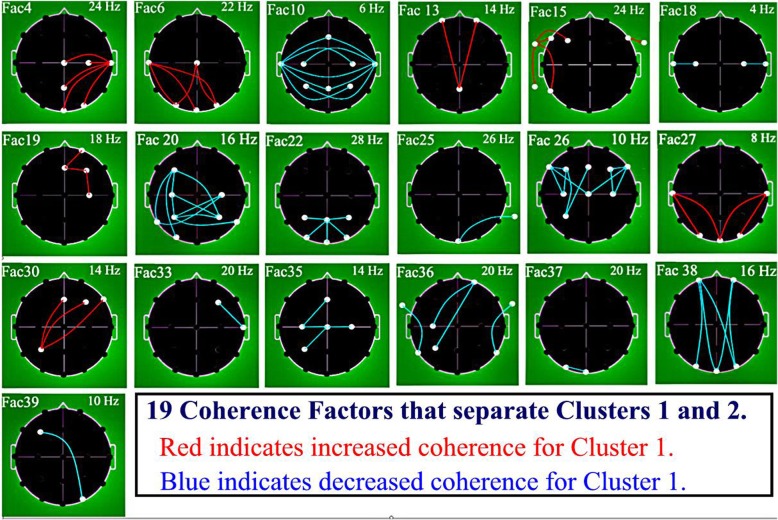
Fig. 4.
Graphic Representation of 19 Coherence Factor Loadings Used in Separating Clusters 1 and 2. Legend: EEG coherence factor loadings. Heads in top view, scalp left to image left, nose above; Factor number is above heads to left and peak frequency for factor in Hz is above to right. Lines indicate top approximate 15% coherence loadings per factor: Red Lines = increased coherence in Cluster 1; Blue Lines = decreased coherence in Cluster 1. Involved electrodes are shown as white circles. Uninvolved electrodes are not shown; they are blackened-out within the superior scalp area and greened-out for scalp electrodes. Factors are shown in numerical order. See text for factor selection order in discriminant analysis

