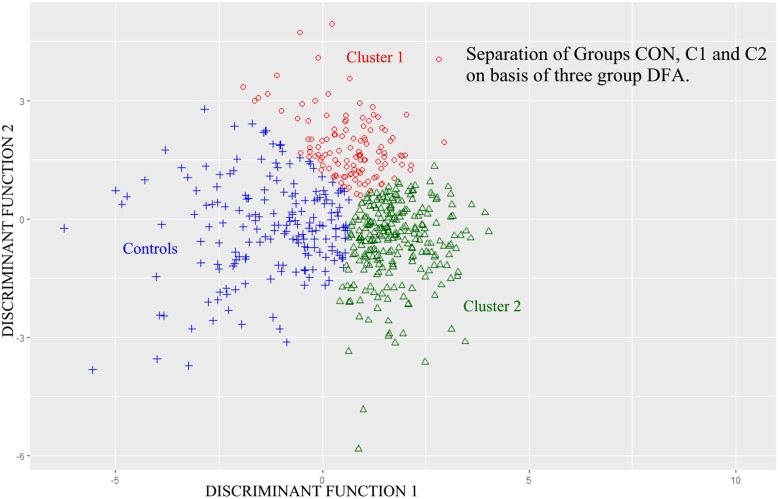
Fig. 6.
C1, C2 and CON Groups Along 3-Group DFA by Discriminant Score. Legend: C1, C2, and CON group population distributions (red circle = C1, green triangle = C2, blue + = CON) with X and Y axes the two 3-group discriminant function scores. Note minimal populations overlap. Overall and among group separations are significant. There is very significant three group subject classification (see text). Note, hierarchical clustering results, upon which this figure is based, tend to illustrate linear group boundaries (whereas K-means clustering tend to produce more circular or ovoid boundaries [32])

