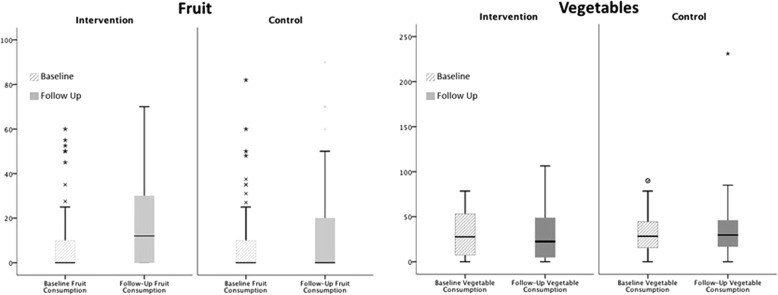
Fig. 1.
Boxplots showing children’s daily consumption of fruit and vegetables at lunchtime. Medians, interquartile ranges, and distributions of children’s consumption in grams for fruit, fiber and sugar, and milligrams for vitamin C are shown at baseline (striped bars) and follow-up (solid bars) for the intervention and control condition. Key statistics for pairwise within- and between-condition tests are presented to aid interpretation of the data

