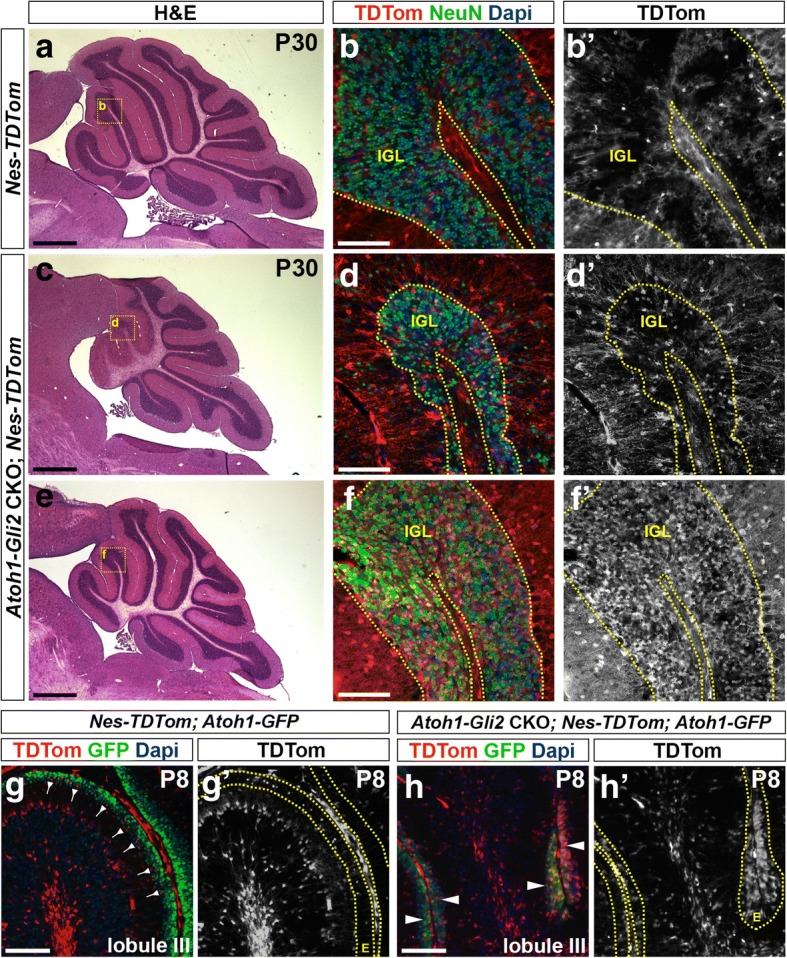
Fig. 5.

Nestin-Expressing Progenitors (NEPs) populate the EGL, express GCP markers and produce granule cells in response to loss of Gli2 in the EGL. a, c and e H&E staining of sagittal sections of the vermis of P30 Nes-FlpoER/+; R26FSF-TDTom/+ (Nes-TDTom, a) and Atoh1-Cre/+; Gli2lox/lox; Nes-FlpoER/+; R26FSF-TDTom/+ (Atoh1-Gli2 CKO; Nes-TDTom, c and e) mice injected with Tm at P0. b, d and f FIHC detection of the indicated proteins and dapi on mid-sagittal cerebellar sections at P30. High power images are shown of the areas indicated by yellow rectangles in (a, c and e). IGL is outlined by yellow dotted lines. g-h FIHC detection of the indicated proteins and dapi on mid-sagittal cerebellar sections (lobule III) of P8 Nes-FlpoER/+; R26FSF-TDTom/+; Atoh1-GFP/+ (Nes-TDTom; Atoh1-GFP, g) and Atoh1-Cre/+; Gli2lox/lox; Nes-FlpoER/+; R26FSF-TDTom/+/+; Atoh1-GFP/+ (Atoh1-Gli2 CKO; Nes-TDTom; Atoh1-GFP, h) mice injected with Tm at P0. The EGL (E) is outlined by yellow dotted lines. Backward arrows indicate TDTom+ and Atoh1-GFP- cells in the inner EGL. White arrowheads indicate TDTom+ and Atoh1-GFP+ cells in the inner EGL. Scale bars represent 1 mm (a, c and e) and 100 μm (b, d, f, g and h)
