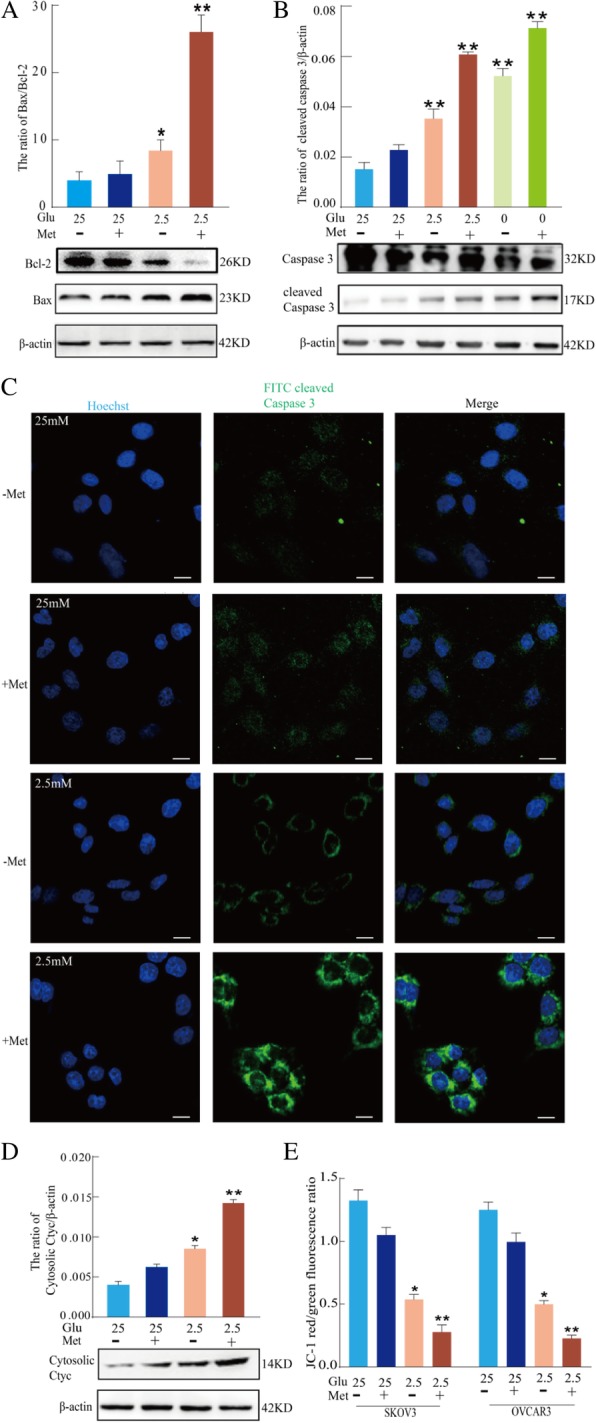
Fig. 2.

Low glucose enhances metformin-induced apoptosis through a mitochondria-associated pathway in human ovarian cancer cells. a Western blot assay of the expression of Bcl-2 and Bax proteins in SKOV3 cells treated with 25 mM or 2.5 mM glucose and 8 mM metformin for 24 h. Quantitation of the ratio of Bax/Bcl-2 protein. Data are presented as a mean ± SD (n = 3; *P < 0.05 and **P < 0.01). b Western blot assay of caspase-3 and cleaved caspase-3 protein expression in SKOV3 cells treated with varying concentrations of glucose and 8 mM metformin for 24 h. Quantitative analysis of cleaved caspase-3 protein expression. Data are presented as mean ± SD (n = 3; **P < 0.01 compared to the control group). c The expression of cleaved caspase 3 in SKOV3 cells was observed by confocal microscopy (bar, 10 μm). d Western blot assay of the expression of cytosolic cyt c protein in SKOV3 cells treated with 25 mM or 2.5 mM glucose and 8 mM metformin for 24 h. Quantitation of the level of cytosolic cyt c proteins. Data are presented as mean ± SD (n = 3; *P < 0.05 and **P < 0.01). e Flow cytometry analysis of JC-1 staining showed that 25 mM or 2.5 mM glucose and metformin in SKOV3 and OVCRA3 cells decreased the mitochondrial membrane potential after 24 h. The ratio of JC-1 red/green fluorescence was calculated using mean fluorescence intensity of each channel. Data are presented as mean ± SD (n = 3; *P < 0.05 and **P < 0.01)
