
Fig. 7.
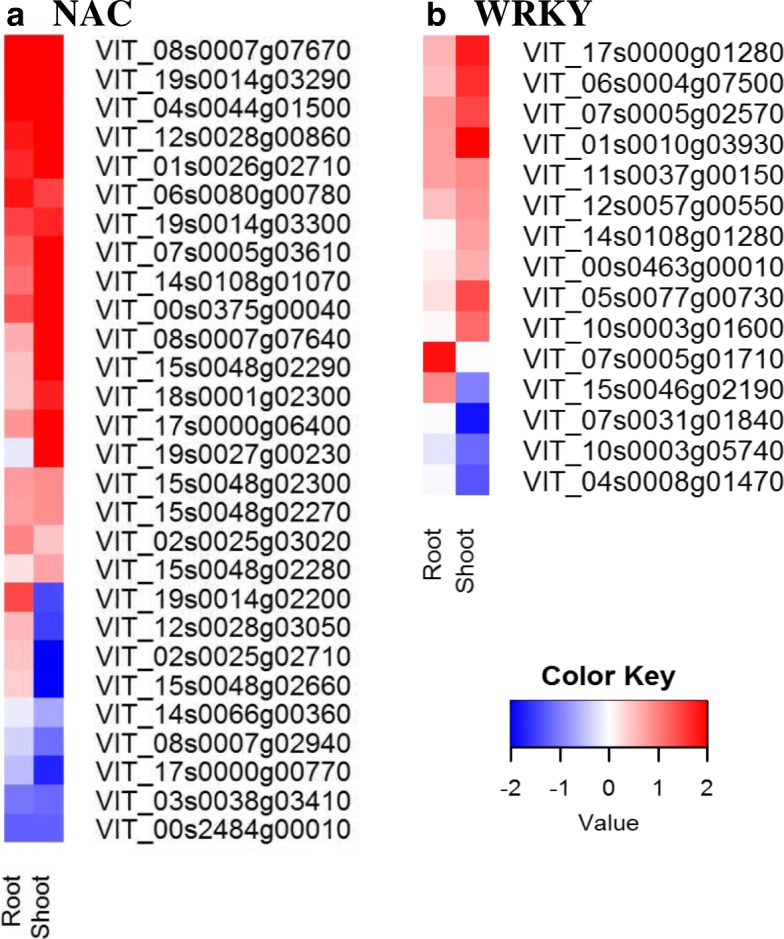
NAC and WRKY transcription factor differential gene expression (DEG) profile in water deficit (WD) root and shoot tissue. a NAC transcription factor DEG. b WRKY transcription factor DEG. The red and blue colors represent up- and down-regulation of the gene expression in water deficit tissue relative to their respect to control tissue in root or shoot. Expression values are expressed fold change WD/C (log2)