
Figure 1.
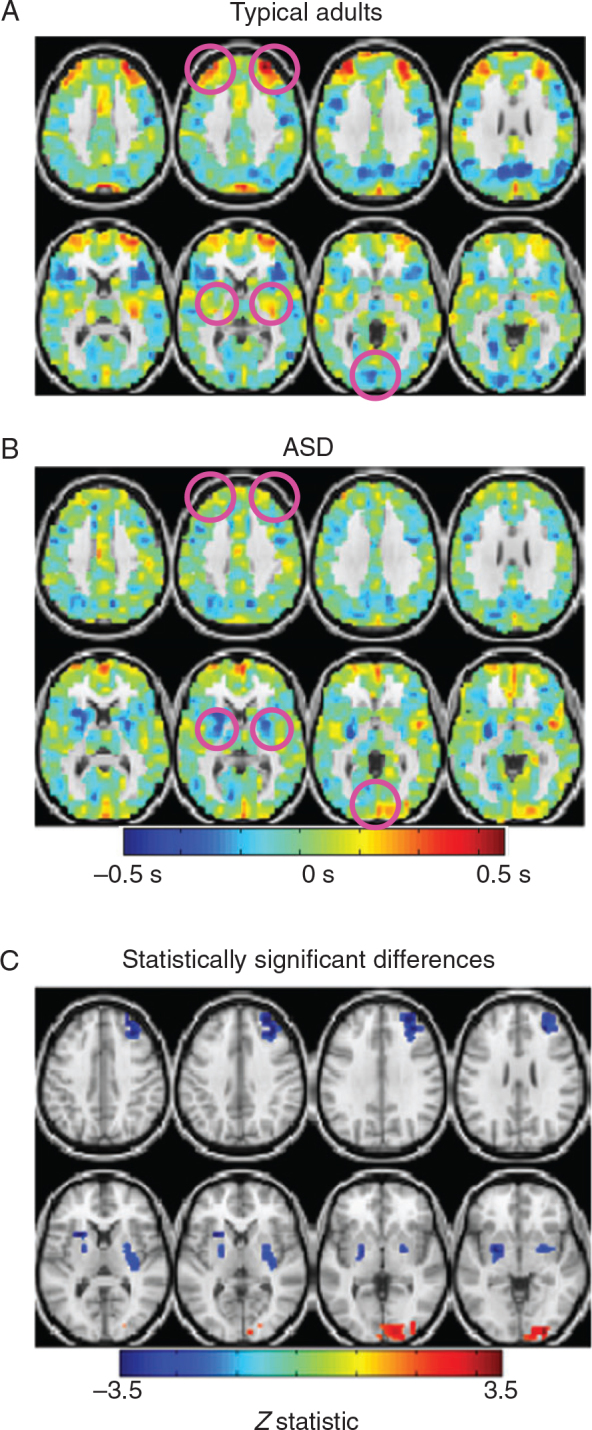
Lag maps reveal focal differences in ASD. ( A ) Group-level lag map in typical adults. Blue hues represent regions that are early with respect to the rest of the brain (negative seconds); red hues represent areas that are late with respect to the rest of the brain (positive seconds). Apparent propagation in the BOLD signal is measured on a time scale of ±0.5 s. ( B ) Group-level lag map in high-functioning adults with ASD. ( C ) Lag difference map, ASD minus typical adults, masked to show spatial clusters exhibiting statistically significant differences (|Z| > 3, P < 0.05; see Methods). Areas with significantly different RS-LA values are in right frontopolar cortex, bilateral putamen, and predominantly right occipital cortex.