
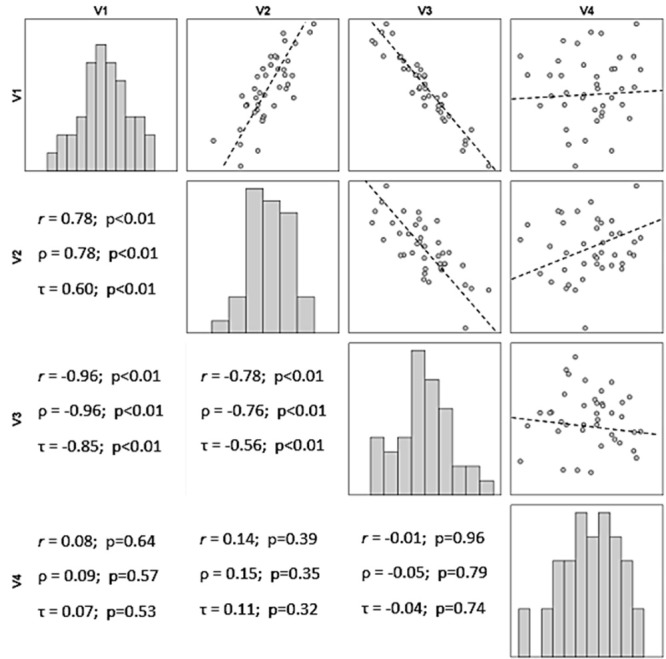
Figure 1. Bar graphs, scatter plots, and correlation coefficients (r: Pearson, ρ: Spearman, and τ: Kendall Tau-b) for four hypothetical quantitative variables V1, V2, V3, and V4 (n = 40).
Official websites use .gov
A
.gov website belongs to an official
government organization in the United States.
Secure .gov websites use HTTPS
A lock (
) or https:// means you've safely
connected to the .gov website. Share sensitive
information only on official, secure websites.