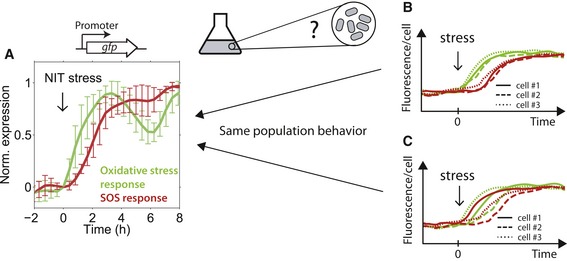
Green line: Normalized population expression level averaged over all OxyR, and SoxS‐regulated promoters; red line: average over all LexA‐regulated promoters (Mitosch
et al,
2017), as measured with a promoter‐GFP plasmid library (Zaslaver
et al,
2006) in a plate reader. Oxidative stress promoters clearly precede SOS response promoters in response to NIT stress, when measured at the population level (Mitosch
et al,
2017). Lines show the mean and error bars show the standard deviation over seven oxidative stress and SOS promoters, respectively (
Materials and Methods). It is not clear if this temporal order correctly reflects the temporal order in single cells.