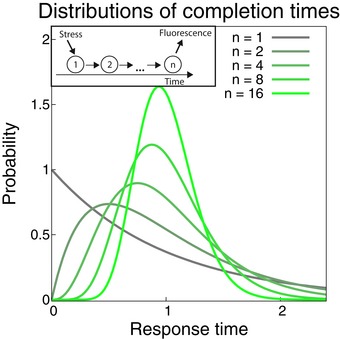
Figure EV1. Signal progression and the distribution of completion times.

Inset: A signal progresses through a system with n steps to elicit a measurable response after the addition of stress. The waiting time for each step is assumed to be exponentially distributed. Main panel: Erlang distributions of completion times for processes with different number of steps (increasing from gray to green), while keeping the mean completion time the same. More, but faster steps in the reaction lead to a tighter distribution around the mean, thus greater timing precision of the response.
