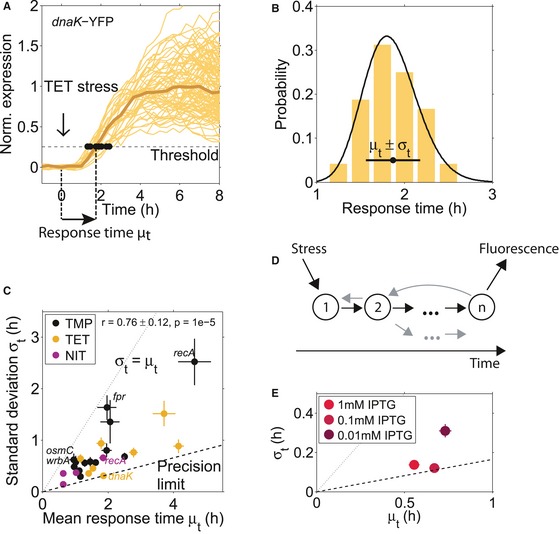
Figure 2. Hard limits constrain the timing variability of individual promoters from above and below.

- Single‐cell gene expression time traces from the dnaK promoter in response to TET stress, normalized to the median full response. Response times were determined as the time point at which a threshold expression level was reached (see main text and Materials and Methods). This threshold was low enough so that most cells exceed it and high enough to avoid false positives due to the low signal‐to‐noise ratio at time point zero. Brown line: median of all cells. Time traces are from one microcolony.
- Histogram of the response times for the dnaK promoter with mean μt = 1.87 h and standard deviation σt = 0.37 h, and fit of an Erlang distribution with shape parameter n = 37 (black line; see text and Materials and Methods). Response times are from two microcolonies.
- Standard deviation σt versus mean response time μt for 23 different promoters (Table EV1) in three antibiotic stress conditions (TMP, TET, and NIT). The standard deviation of the response time σt grows with the mean response time μt and does not fall below a “precision limit” (dashed line) that increases linearly with a slope ˜ 0.165. The dotted line indicates the upper bound to timing variability where σt = μt, see text. The promoter dnaK under TET has low timing variability, whereas the promoters recA, fpr, osmC, and wrbA under TMP stress have high timing variability. The response time mean and standard deviation are from subsampling of descendants of single cells that were present at the time of stress addition (Materials and Methods). Subsampling for each promoter was done from at least two microcolonies, and the descendants of at least 17 individual cells present at the time of stress addition.
- Schematic of a molecular chain of n events triggered by stress and resulting in measurable fluorescence, according to the statistical kinetics model applied here. The gray arrows indicate possible deviations from a linear chain of events, like feedback, reversibility, or branching, which are also captured in the model.
- Standard deviation σt versus mean response time μt for the LlacO‐1 promoter induced with different IPTG concentrations. Note that all cells crossed the defined threshold under the tested IPTG concentrations. The dashed and dotted lines are the same as in (C).
