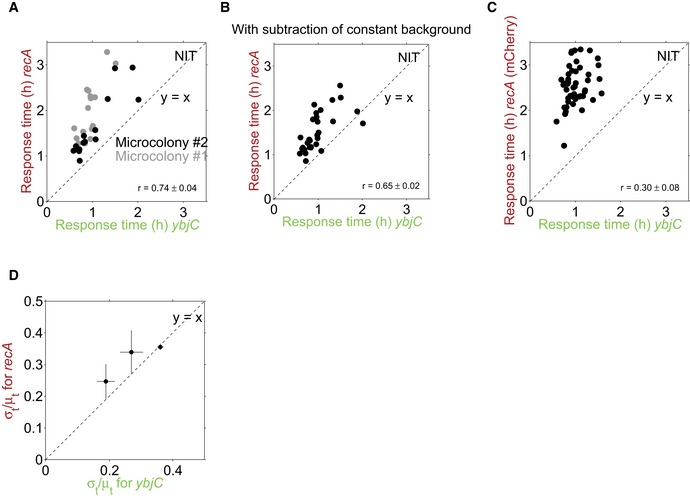
Figure EV4. Temporal order and response time correlation are independent of the specific microcolony, background subtraction, and the specific fluorophore used.

- Same data as in Fig 4C, but shown for each of the two microcolonies (black and gray data points, respectively). Clear temporal order and strong response time correlations are present in each microcolony.
- Same data as in Fig 4C, but background was subtracted as a constant for all time points and not specifically for each time point. Clear temporal order and response time correlation are independent of background subtraction (r = 0.65, P = 9.9 × 10⁻⁵).
- Response times for ybjC, combined as before with YFP, and recA, combined with mCherry instead of CFP as a control. The clear temporal order is also present here; the response time correlation is weaker (r = 0.30, P = 0.05). This may be explained by the longer maturation time of mCherry (Balleza et al, 2017) which may blur correlations.
- The ratio of σt/μt for recA versus ybjC from three replicate experiments. Error bars are from subsampling of descendants of single cells which were present at the time of stress addition (Materials and Methods).
