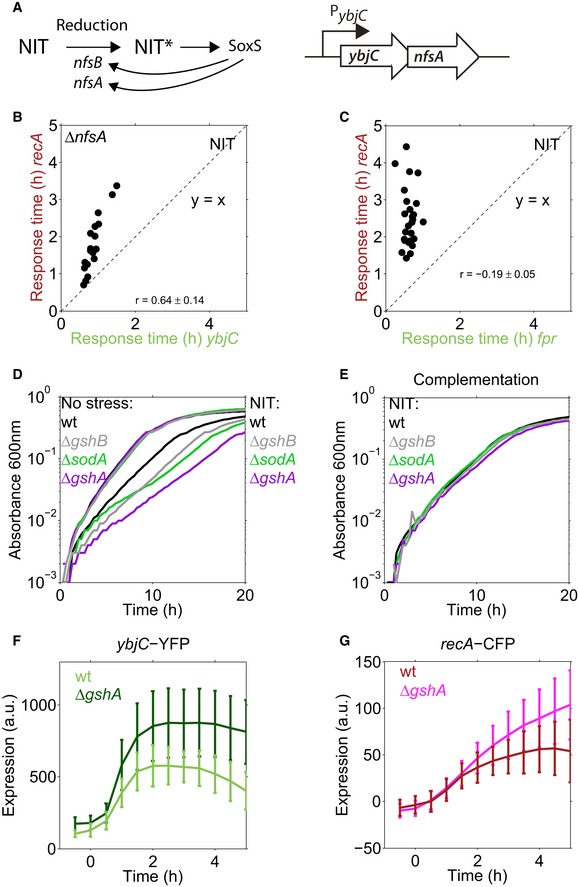
Figure EV5. Gene expression and growth rate of knockout mutants under NIT stress, and temporal order for another oxidative stress promoter fpr .

- The prodrug NIT is reduced to active nitro anion radicals by the nitroreductases NfsA and NfsB leading to oxidative stress. The oxidative stress transcription factor SoxS activates transcription of both nitroreductases (Keseler et al, 2017), potentially resulting in a positive feedback loop. The nfsA gene is in an operon with ybjC, controlled by the ybjC promoter.
- Sequential temporal order and response time correlation between ybjC and recA are also present in a ΔnfsA strain.
- Sequential temporal order is also present between another oxidative stress promoter, fpr, and recA. The positive response time correlation is absent.
- Absorbance at 600 nm over time for the wild type and oxidative stress mutants (ΔsodA, ΔgshA, ΔgshB) under no stress condition and under 4 μg/ml NIT.
- Same as (D), with 4 μg/ml NIT but the knockout strains were complemented with the respective gene (Materials and Methods), induced by 1 mM IPTG (Materials and Methods).
- Expression of ybjC‐YFP in response to 1.5 μg/ml NIT, added at t = 0, in the wild type and in a gshA knockout mutant. Lines are the mean, error bars are the standard deviation over the cells from three microcolonies for ΔgshA and two microcolonies for the wild type.
- Expression of recA‐CFP in response to 1.5 μg/ml NIT, added at t = 0, in the wild type and in a gshA knockout mutant. Lines are the mean, error bars are the standard deviation over the cells from three microcolonies for ΔgshA and two microcolonies for the wild type, the same microcolonies as in (F).
