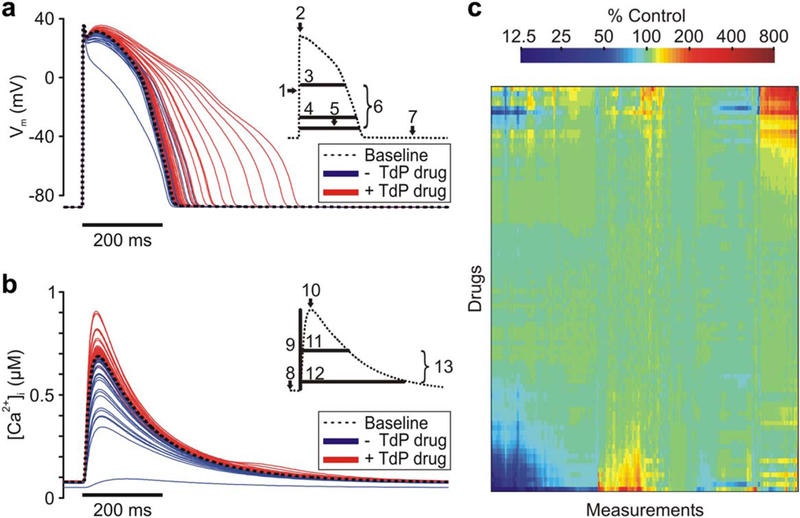
Figure 1.

Drug response in human ventricular cell models. (a) Action potential (AP) traces for baseline model and under simulated exposure to each drug. Torsadogenic (+Torsades de Pointes (TdP)) drug APs are red, and nontorsadogenic (-TdP) drug APs are in blue. Inset, AP metrics: (1) upstroke velocity; (2) peak membrane voltage (Vm); (3) AP duration (APD) at 50% repolarization; (4) APD at-60 mV; (5) APD at 90% repolarization; (6) AP triangulation; and (7) resting Vm. (b) Ca2+ transient (CaT) traces for baseline model and under simulated exposure to each drug. Torsadogenic (+TdP) drug CaTs are red, and nontorsadogenic (-TdP) drug CaTs are in blue. Inset, CaT metrics: (8) resting (Ca2+)i (9) CaT amplitude, (10) Peak (Ca2+)i (11) CaT duration at 50% return to baseline, (12) CaT duration at 90% return to baseline, and (13) CaT triangulation. (c) Heatmap of 331 metrics measured under exposure to drug set. Color indicates percent change in metric from baseline value. Drugs and metrics are ordered by unsupervised hierarchical clustering. [Color figure can be viewed in the online issue, which is available at wileyonlinelibrary.com.]
