
Figure 3.
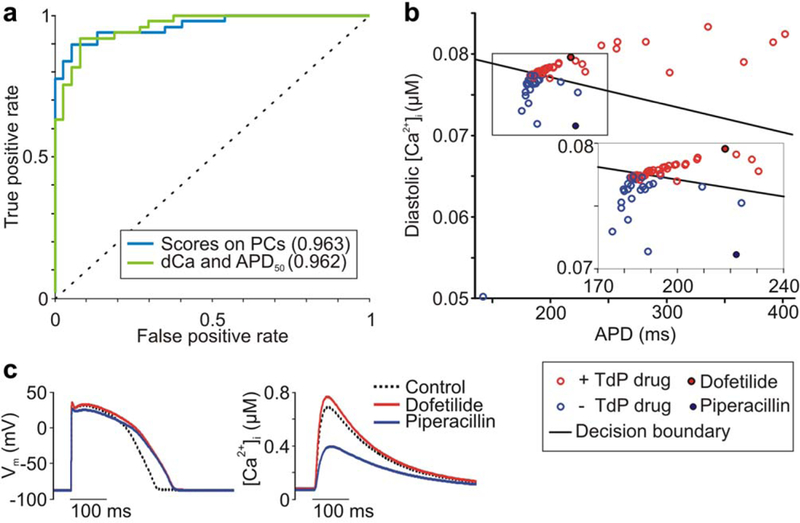
Selected action potential and Ca2+ transient metrics discriminate torsadogenic from nontorsadogenic drugs. (a) Accuracy of classification assessed using receiver operating characteristic analysis. The support vector machine (SVM) model based on diastolic Ca2+ (dCa) and action potential duration (APD) is compared to the SVM model based on drugs scores on three principal components (PCs). Predictive power is quantified by the area under the curve, listed in parentheses in the legend. (b) Diastolic Ca2+ (uM) vs. APD (ms) for drug set. SVM decision boundary is shown as a black line, torsadogenic (+Torsades de Pointes (TdP)) drugs are shown as red circles, and nontorsadogenic (-TdP) drugs are shown as blue circles. (c) Ca2+ transients (right), but not action potentials (left), distinguish dofetilide from piperacillin. [Color figure can be viewed in the online issue, which is available at wileyonlinelibrary.com.]