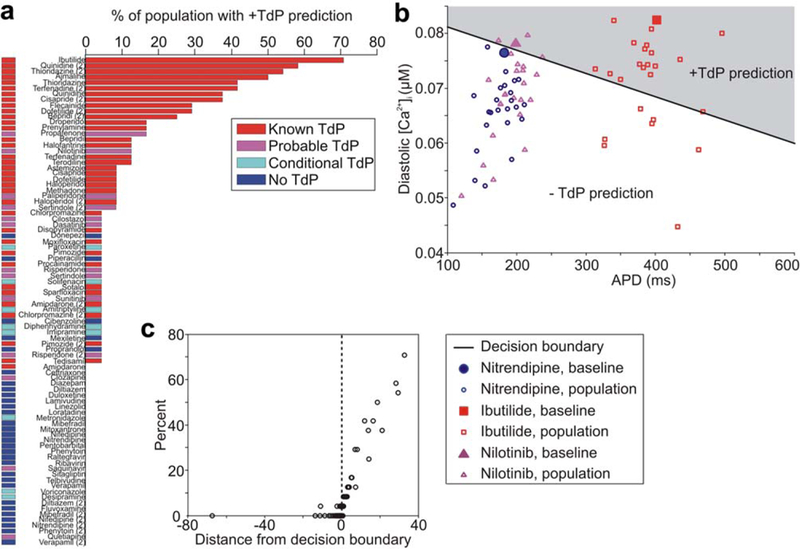
Figure 5.

Drug risk prediction in a synthetic population. (a) Percent of individuals in synthetic population in whom each drug is classified as torsadogenic (+Torsades de Pointes (TdP)). Drug bars are colored by known drug risk. (b) Population distribution in risk space for ibutilide, nilotinib, and nitrendipine. APD is the action potential duration. (c) Percent of population in whom the drug is classified as torsadogenic vs. drug distance from classifier decision boundary in baseline model. Positive distance results in a torsadogenic prediction, and negative distance results in a nontorsadogenic prediction. [Color figure can be viewed in the online issue, which is available at wileyonlinelibrary.com.]
