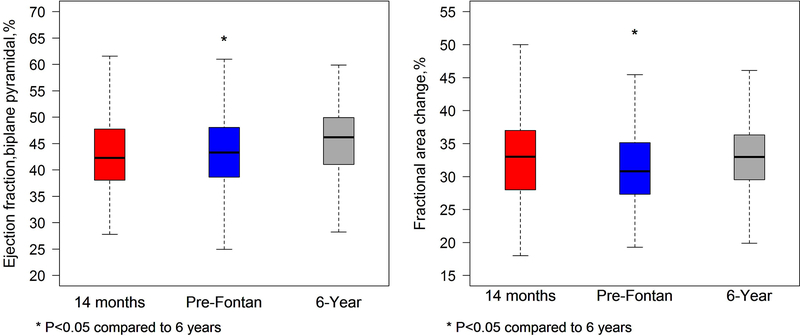
Figure 1.
Graph comparing right ventricular ejection fraction (left panel) and fractional area change (right panel) for the cohort with paired studies at the 14 months, pre-Fontan, and 6-year intervals. There was a significant increase in both the ejection fraction and fractional area change from the pre-Fontan to the 6-year echocardiogram. There was a trend toward increased right ventricular ejection fraction from 14 months to 6 years (p=0.06), but fractional area change was similar between those stages.

