
FIGURE 3. PLD deficiency impacts alveolar barrier disruption.
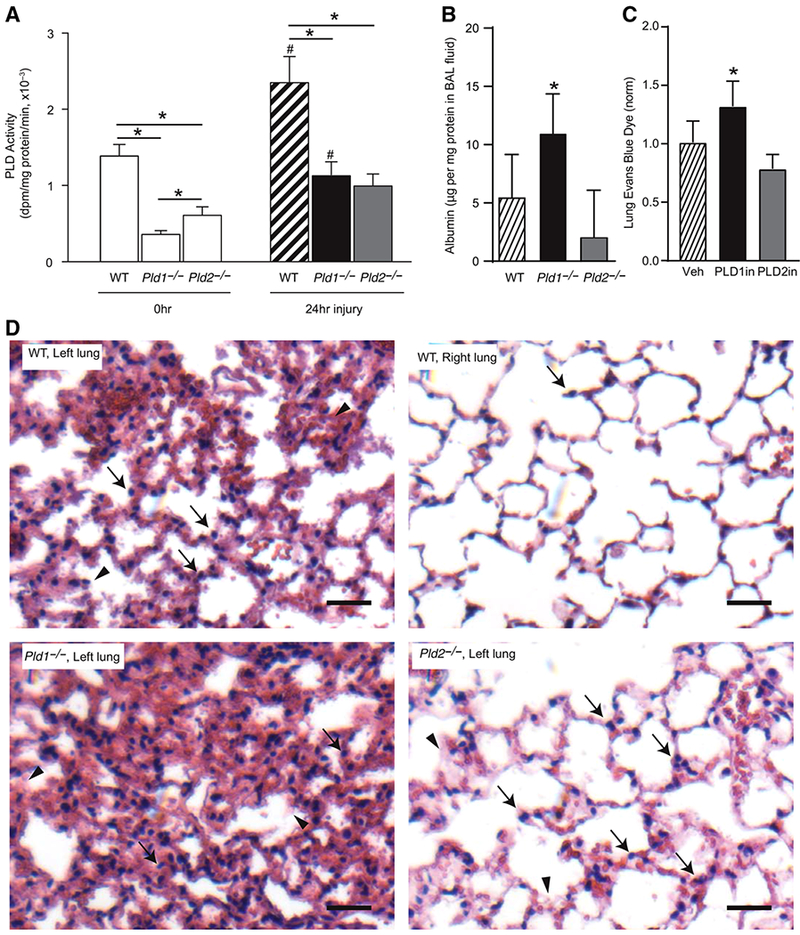
(A) Total lung PLD activity in wild-type (WT) mice, and mice deficient in Pld1 and Pld2 gene, at t = 0 and t = 24 h after intrabronchial HCl. Results are expressed as mean ± SEM, N ≥ 10, *P < 0.05. (B) Albumin levels in BAL fluid from WT, Pld1−/−, and Pld2−/− animals 24 h after intrabronchial HCl. (C) Evans blue dye levels in left lung homogenate 24 h after intrabronchial HCl and treatment with a selective inhibitor of PLD1 (PLD1in, black) or PLD2 (PLD2in, gray), or vehicle (Veh, hatched). Results are expressed as mean ± SEM, N ≥ 10, *P < 0.05. (D) Representative lung sections from WT (injured left lung and uninjured right lung from same animal), Pld1−/−, and Pld2−/− animals