
FIGURE 5. PLD genetic deficiency is associated with increased macrophage–neutrophil interactions.
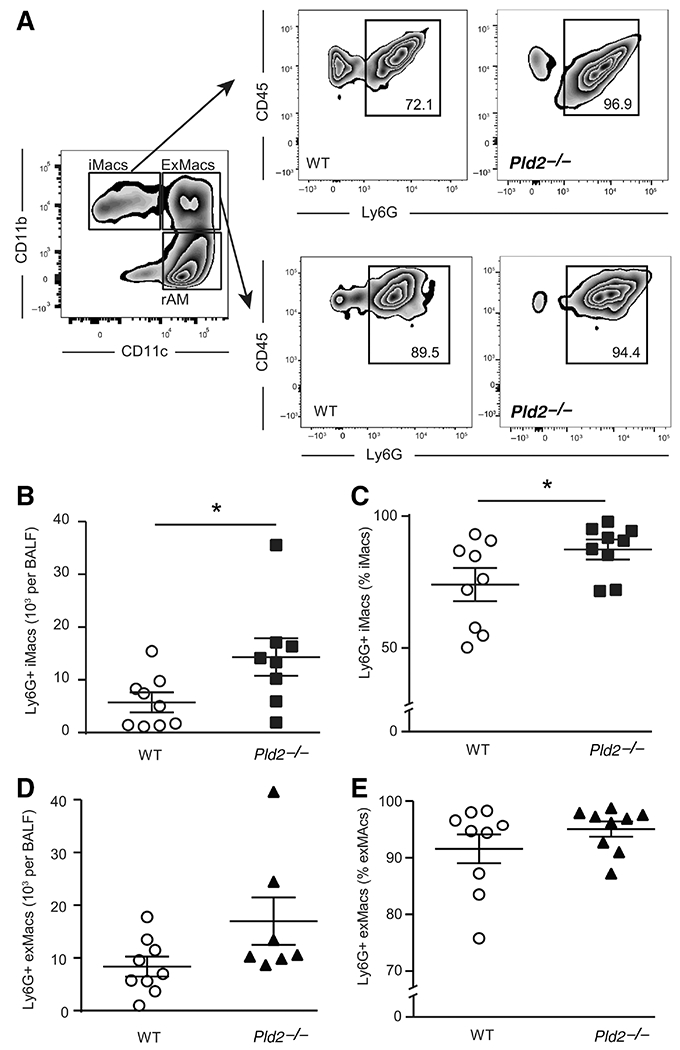
(A) Representative dot plots of macrophage–neutrophil interactions as determined by Ly6G staining gated on macrophage subsets in BAL obtained 24 h after intrabronchial acid. (B) Absolute count and (C) percentage of iMacs that interact with neutrophils. (D) Absolute count and (E) percentage of exMacs that interact with neutrophils. Results are expressed as mean ± SEM. n ≥ 6 per group. *P < 0.05