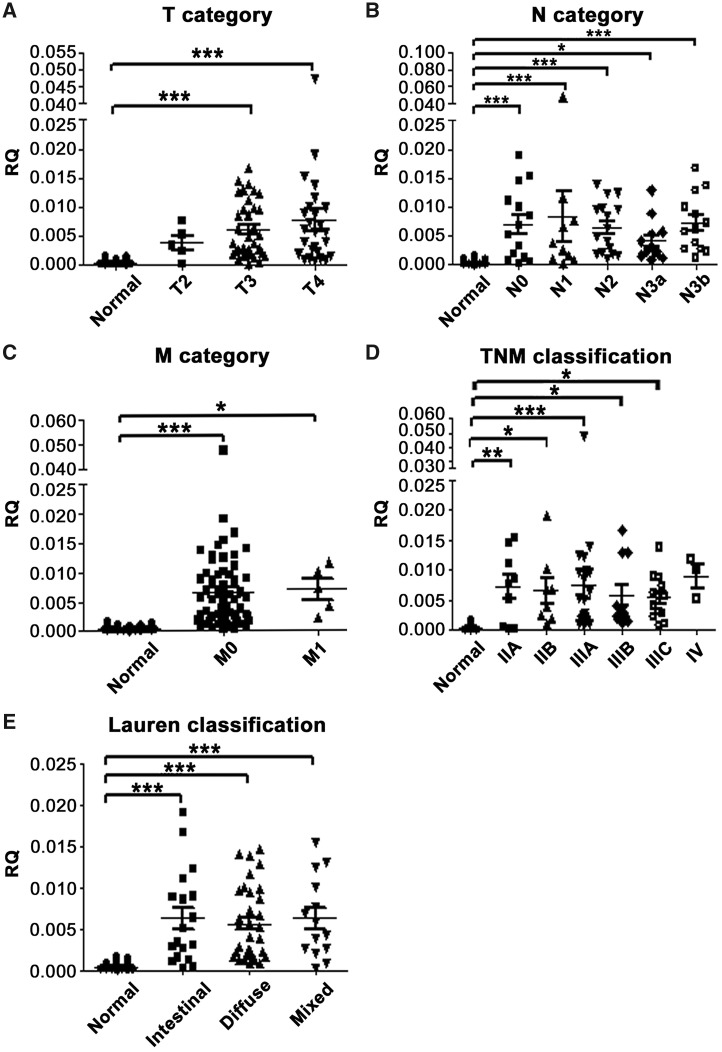
Figure 3.
Association between INHBA mRNA expression level and clinicopathological features in gastric-cancer tissues. The graphs illustrate the mean relative quantity (RQ) value of each group. INHBA expression level was associated with (A) tumor depth/T category (normal vs T3, P < 0.001 and T4, both P < 0.001); (B) nodal status/N category (normal vs N0, N1, N2 and N3b, all P < 0.001; normal vs N3a, P = 0.049); (C) distant metastasis/M category (normal vs M0, P < 0.001; M0 vs M1, P = 0.014); (D) TNM classification (normal vs IIA, IIB, IIIA, IIIB and IIIC, P = 0.006, 0.026, < 0.001, 0.023 and 0.023, respectively); and (E) Lauren classification (normal vs intestinal type, diffused type and mixed variant, all P < 0.001). *P < 0.05; **P < 0.01; ***P < 0.001. Columns that did not demonstrate statistical association between cancer and normal tissues are not labeled. INHBA, inhibin beta A.

