Figure 5.
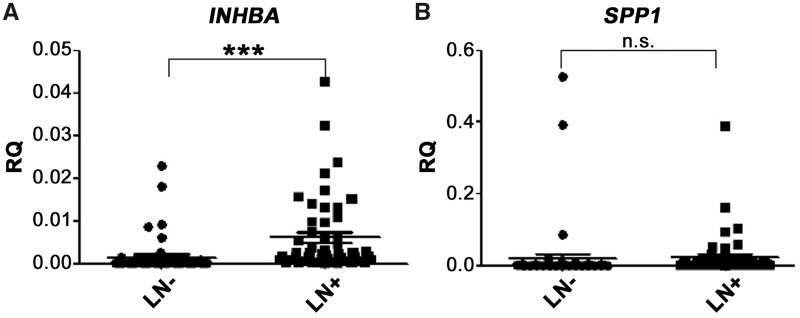
mRNA level of INHBA and SPP1 in 54 LN– and 50 LN + samples. (A) INHBA can be seen to be significantly up-regulated in L+ (P < 0.001), whereas (B) no significant difference for SPP1 were found (P = 0.470). The graphs illustrate the mean relative quantity (RQ) value of each group; LN–, non-metastatic lymph nodes; L+, metastatic lymph nodes; n.s., no significance; ***P < 0.001. INHBA, inhibin beta A; SPP1, secreted phosphoprotein 1; LN, lymph node.

