. 2018 Dec 14;10(7):2067–2074. doi: 10.1039/c8sc02847h

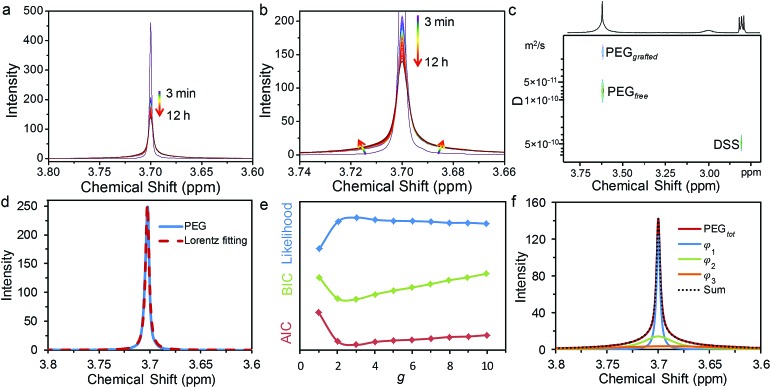
Fig. 1. Temporal evolution of 1H NMR spectra (a and b) to monitor the grafting process of HS-PEG onto the surface of GNPs in D2O. The evolution of the colour from violet to red indicated an increase in grafting-to time. NMR spectra were obtained by following the grafting process up to 12 h with a variable time interval of 1 (3–5 min), 5 (5–120 min), or 30 min (120–720 min). (c) DOSY spectrum of the PEG signal after grafting-to the surface of GNPs. (d) Lorentz fitting for 1H NMR spectra of pure PEG molecules. (e) Evolution of log likelihood (blue), BIC (green) and AIC (red) with the number of components, g. (f) Multi-Lorentzian-splitting to isolate free PEG from the mixtures with grafted PEG using three evaluation criterions.

Fig. 1