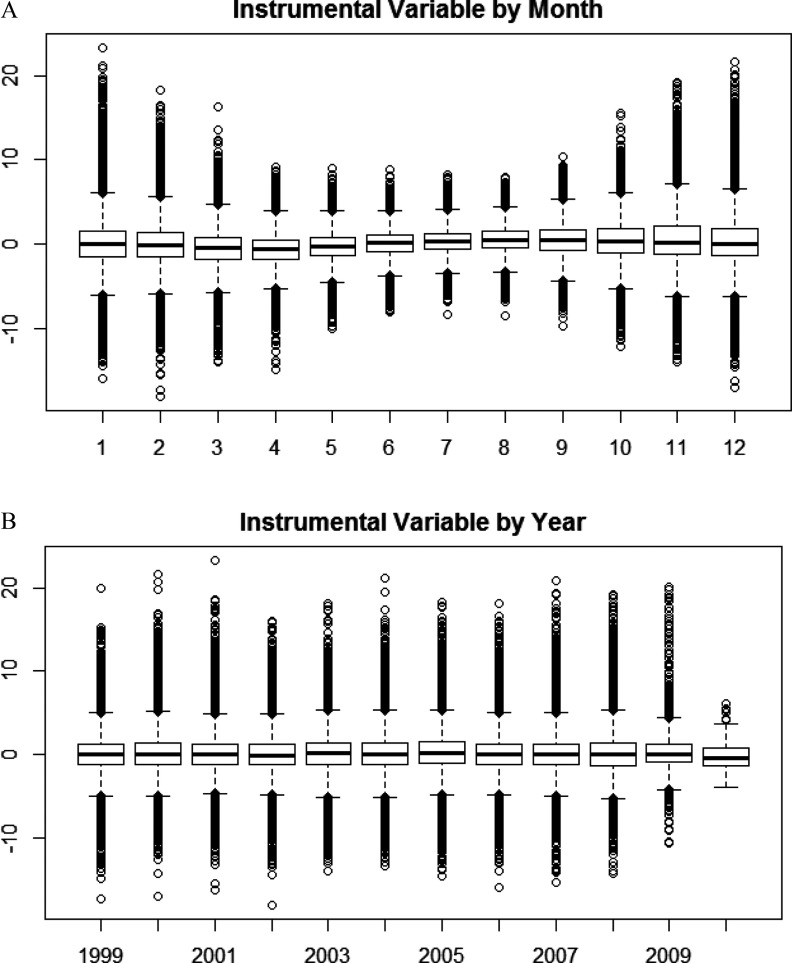
Figure 3.
A boxplot of the value of the instrumental variable for by month of the year (A) and by year (B) in the study, to examine whether exposure is balanced by month and year. The central line in a boxplot is the median, the top and bottom of the box are the upper and lower quartiles, and the circles show the extreme values.

