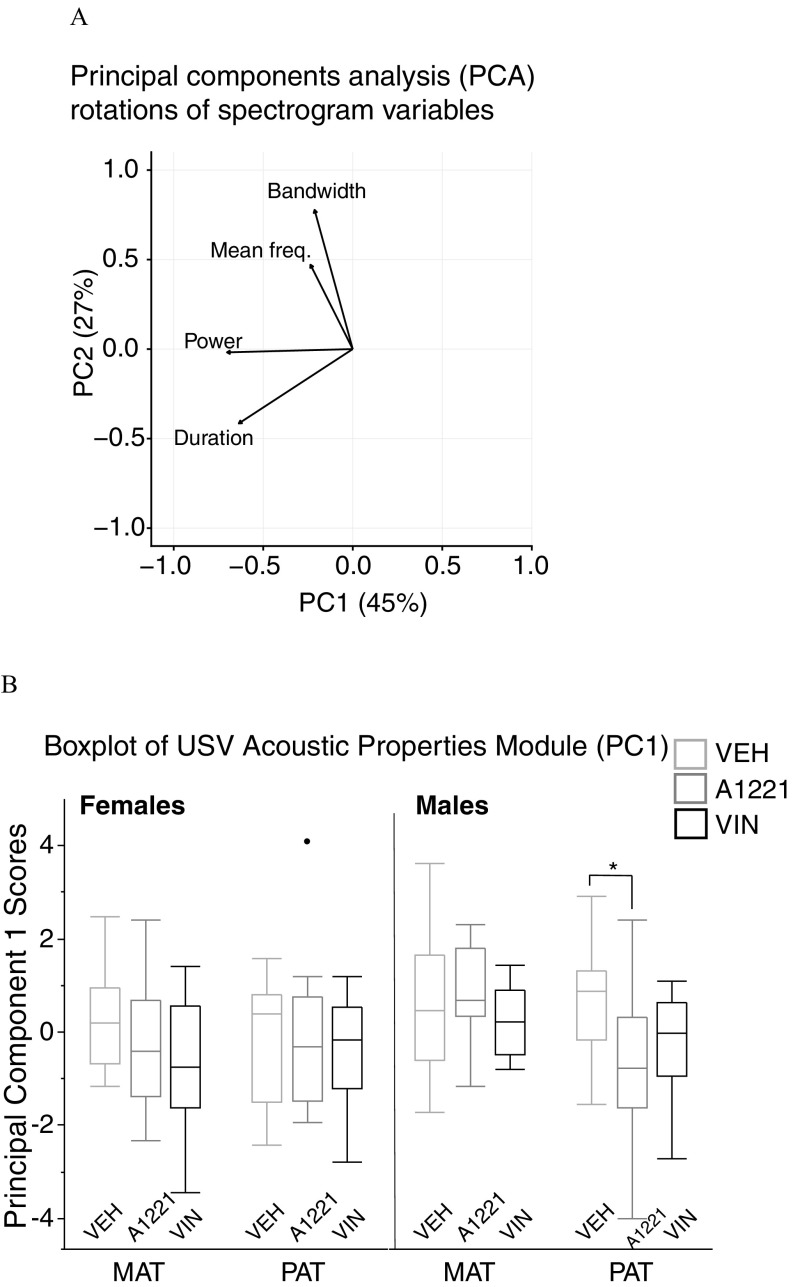
Figure 6.
(A) Principal components analysis (PCA) with spectrogram measures, and (B) boxplots of USV Acoustic Properties Module scores from principal component 1 (PC1). Arrows indicate the directionality of loading of each variable onto each PC. (B) Boxplot data are shown as median (line), with the 25th percentile and 75th percentile indicated by the upper and lower quartiles of the box. Whiskers represent the furthest points within interquartile range (IQR) of the limits of the box (75th quartile minus 25th quartile). A single datapoint (black circle) in the paternal A1221 females was a statistical outlier. Note: A1221, Aroclor 1,221; MAT, maternal; PAT, paternal; VEH, vehicle; VIN, vinclozolin. * determined by one-way analysis of variance (ANOVA).

