. 2018 Sep 13;126(9):097005. doi: 10.1289/EHP3550

Figure 9.

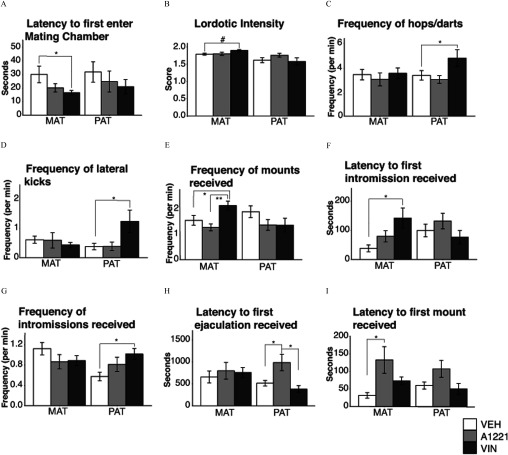
Figures 9A, 9F, 9H, and 9I are bar graphs with mean plus or minus S E M plotting seconds (y-axis) for latency to first enter mating chamber, latency to first intromission received, latency to first ejaculation received, and latency to first mount received, respectively, across maternal and paternal females (x-axis) for V E H, A1221, and V I N. Figure 9B is a bar graph with mean plus or minus S E M plotting score (y-axis) for lordic intensity (y-axis) across maternal and paternal females (x-axis) for V E H, A1221, and V I N. Figures 9C, 9D, 9G, and 9E are bar graphs with mean plus or minus S E M plotting frequency per minute (y-axis) for frequency of hops or darts, frequency of lateral kicks, frequency of mounts received, and frequency of intromissions received, respectively, across maternal and paternal females (x-axis) for V E H, A1221, and V I N.

Females were observed for sexual behavior in a paced mating chamber. Latency to first enter the (A) mating chamber, (B) lordotic intensity, (C) frequency of hops/darts, (D) frequency of lateral kicks to males, (E) frequency of mounts received, (F) latency to receive a first intromission, (G) frequency of intromissions, (H) latency to first ejaculation, and (I) latency to first mount are shown as mean±standard   error   the   mean  (SEM). Note: A1221, Aroclor 1,221; MAT, maternal; PAT, paternal; VEH, vehicle; VIN, vinclozolin. #p<0.1; *p<0.05; **p<0.01 as determined by analysis of variance (ANOVA) followed by Tukey’s HSD posthoc analysis.