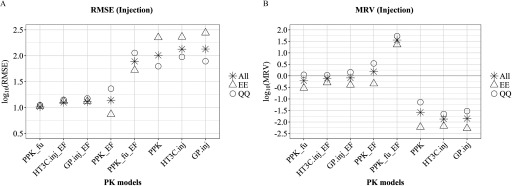
Figure 2.
Comparison of PK model-adjustment performance: injection dosing. The performance of 8 PK model-adjustment combinations (detailed in Methods and below) was compared using root mean squared error (RMSE) (A) and mean residual values (MRV) (B) between values of EAD and median LELs from uterotrophic injection studies, calculated for three groups of chemicals: all 29 chemicals (asterisk), 13 chemicals with experimental values for and (EE, triangle symbol), and 14 chemicals where QPPR and QSAR models were used to predict both and , respectively (QQ, circle symbol). PPK, one-compartment population-based pharmacokinetic model; , the httk “3compartment” model simulating injection exposure route; , PBPK model built using GastroPlus™ software simulating injection exposure route. PPK_EF, , are corresponding PPK, and models with EF adjustment applied for . is PPK model with adjustment applied for in vivo in EAD calculation. is PPK model with EF applied for and adjustment applied for in vivo in EAD calculation. , pseudo median activity concentration at cutoff from estrogen receptor pathway model; , intrinsic clearance (); EAD, equivalent administered dose; EF, enrichment factor; , fraction of chemical unbound to plasma protein; LEL, lowest effect level; QPPR, quantitative property-property relationship; QSAR, quantitative structure-activity relationship; PK, pharmacokinetic.

