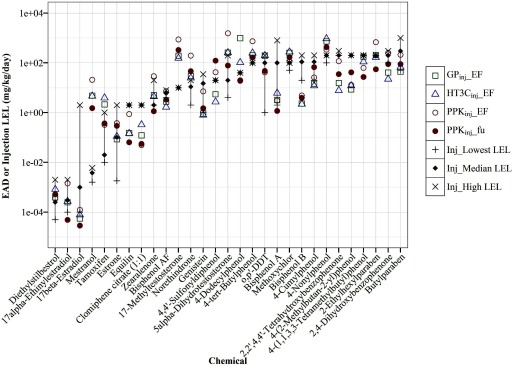
Figure 4.
Chemical-specific EAD predictions compared with injection LELs. EAD values (mg/kg/day) were predicted from using (square), (triangle) and PPK models (circle) with EF or ; adjustments were plotted against the median or mean (if only two studies), highest, and lowest LELs (mg/kg/d) of uterotrophic injection studies for 29 chemicals. The gray line highlights the range from lowest (“”) to highest (“x”) LELs of all guideline-like uterotrophic injection studies. The chemicals are ordered from left to right based on their median or mean (if only two studies) LEL values, from low to high. Data for this figure are provided in Excel Table S1. , pseudo median activity concentration at cutoff from estrogen receptor pathway model; , intrinsic clearance (); , steady-state plasma concentration; EAD, equivalent administered dose; EF, enrichment factor; , fraction of chemical unbound to plasma protein; LEL, lowest effect level; , PBPK model built using GastroPlus™ software simulating injection exposure route; , the httk “3compartment” model simulating injection exposure route; PPK, one-compartment population-based pharmacokinetic model.

