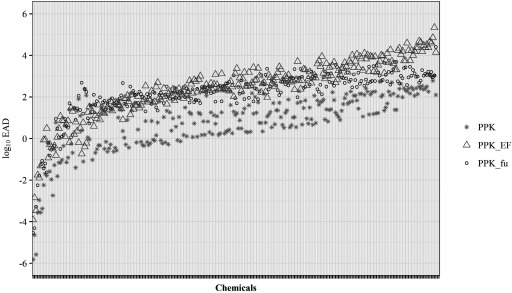
Figure 6.
Estrogenic Dose Predictions for 266 Chemicals. EAD values ( scale) were predicted from for all 266 potential ER agonists from the ToxCast™ ER pathway model, using the PPK model (∗ symbol) and PPK model with EF (triangle) or (circle) adjustments. PPK, one-compartment population-based PK pharmacokinetic model; PPK_EF, PPK model with EF adjustment applied for in EAD calculation. , PPK model with adjustment applied for in vivo in EAD calculation. Data for this figure are provided in Excel Table S3. , pseudo median activity concentration at cutoff from estrogen receptor pathway model; , intrinsic clearance (); , steady-state plasma concentration; EAD, equivalent administered dose; EF, enrichment factor; ER, estrogen receptor; , fraction of chemical unbound to plasma protein.

