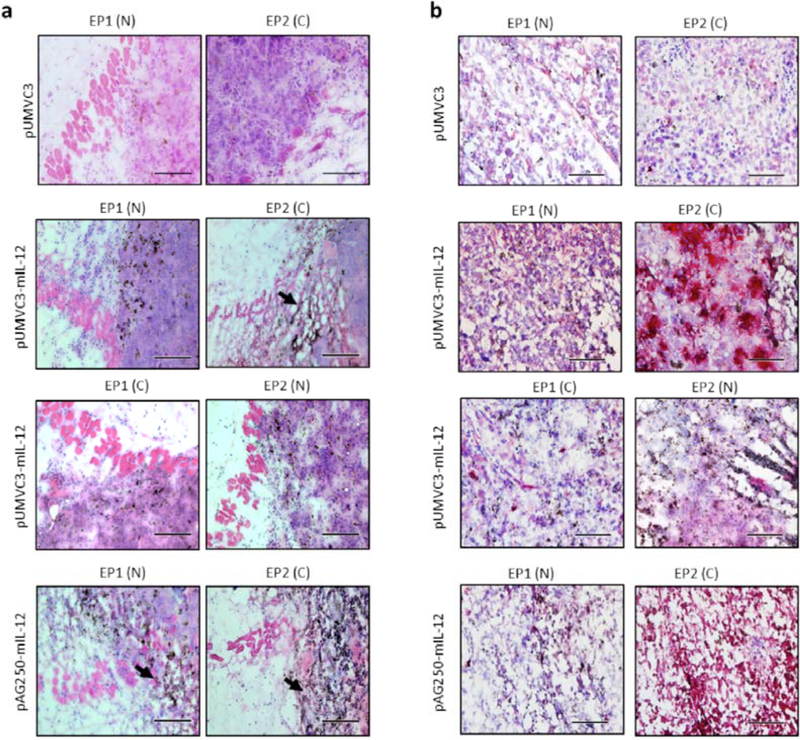
Fig. (2).
Histology of tumors 24 hrs after IL-12 GET. Hematoxylin and eosin staining (a) reveal tumor morphology and damage as a result of GET. Images were taken towards the edge of the tumor. Immunohistological staining (b) of IL-12 (red) expressed in central region of the tumor after electrotransfer. Sections are counterstained with haematoxylin (blue). Images are best representative sections from n = 2 tumors. Scale bar represents (a) 100 μm and (b) 200 μm.

